A graph is given below. Analyse the graph and
How to use the graph to predict the trend to I.E. and electropositivity in the same group.
 Solution in Malayalam
Step by step video & image solution for A graph is given below. Analyse the graph and How to use the graph to predict the trend to I.E. and electropositivity in the same group. by Chemistry experts to help you in doubts & scoring excellent marks in Class 11 exams.
Updated on:21/07/2023Similar Questions
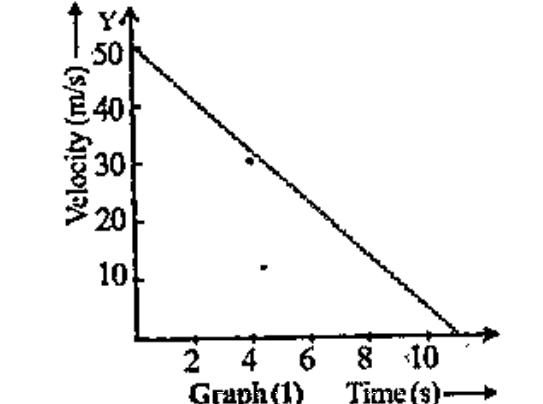
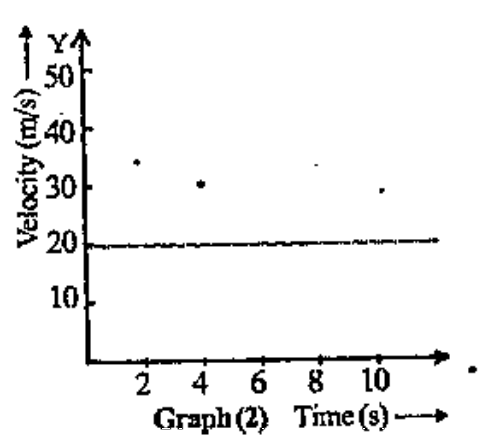
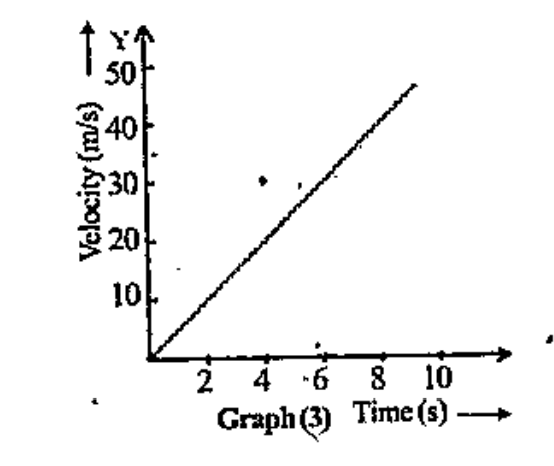
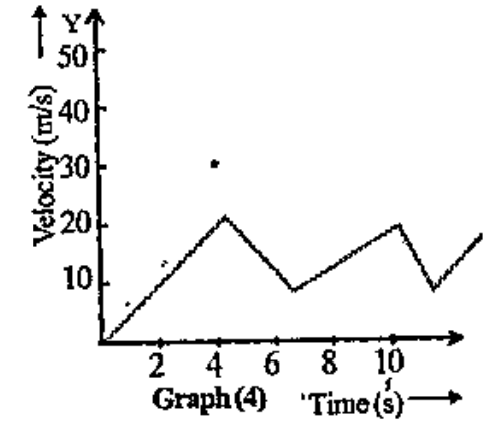
Analyse the graphs given below.
Which graph indicates the motion of freely falling stone?
View SolutionRead the bar graph given below :
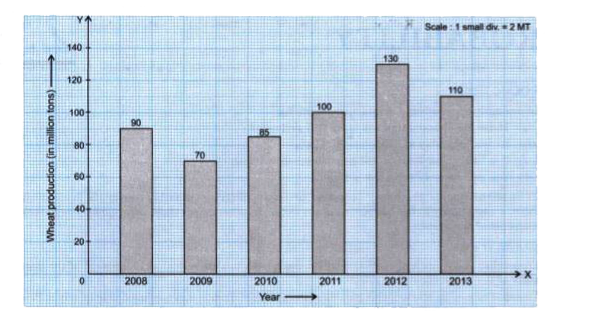
What information is given by the bar graph?
View SolutionThe graph of f(x) is given below.
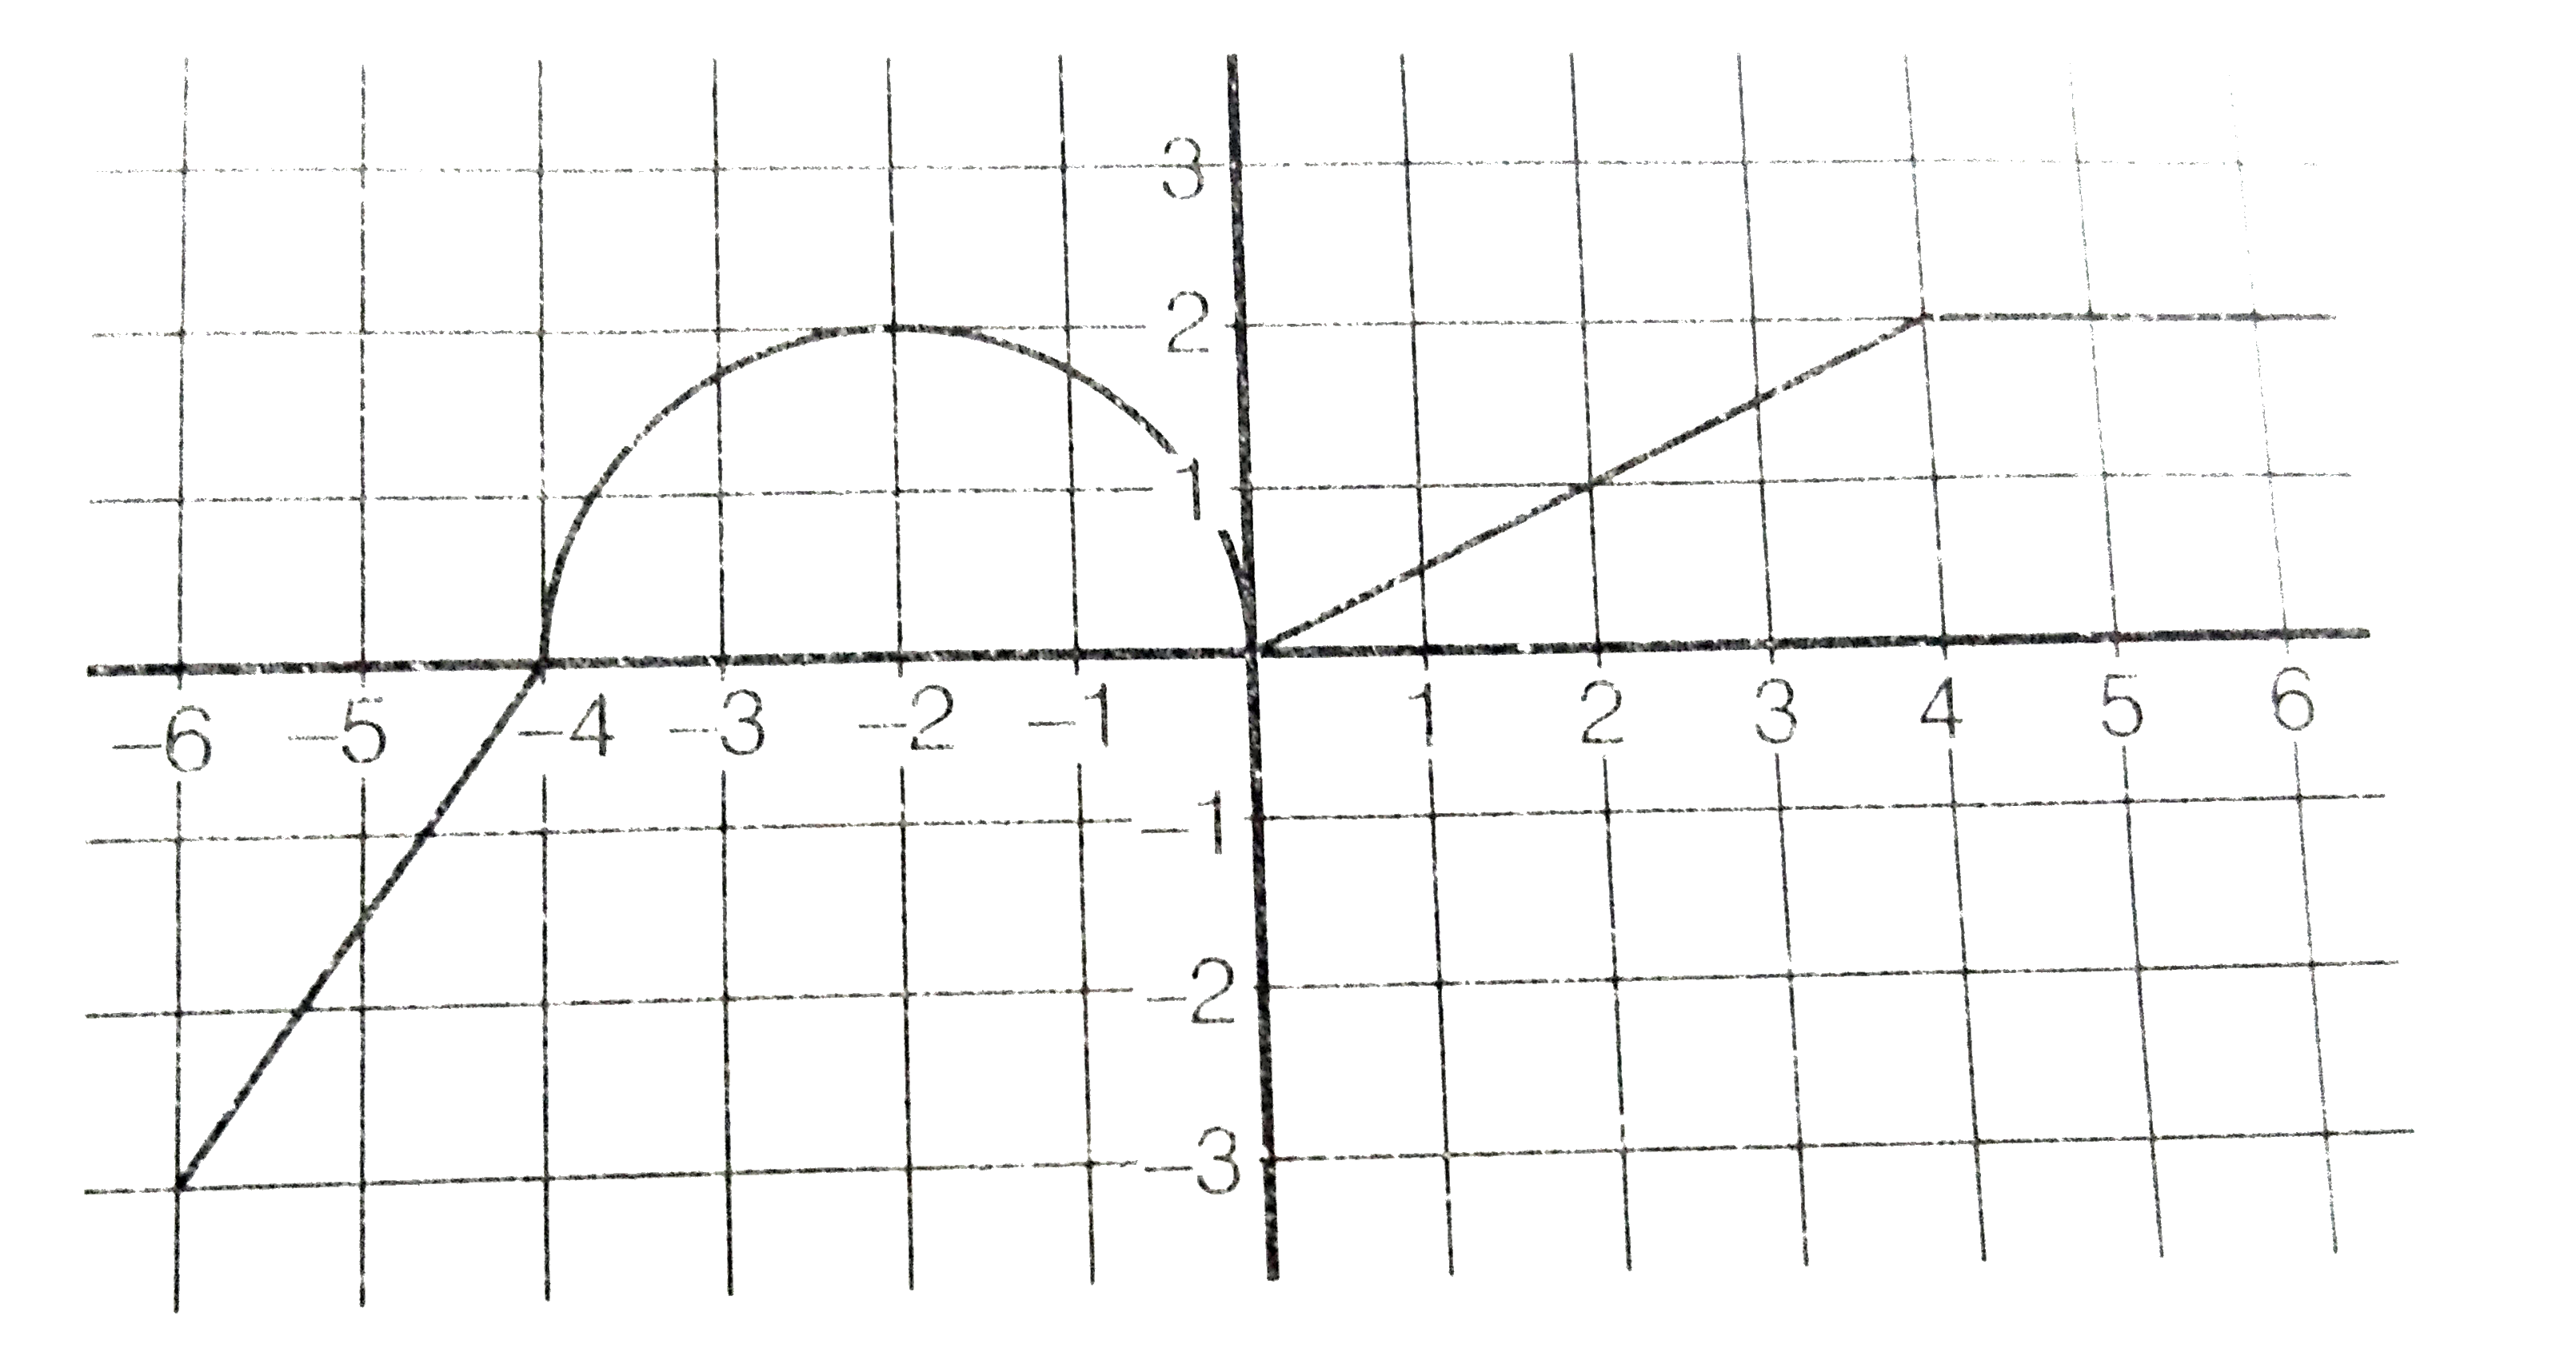
Then, (a) Graph of −f(x)+2 is

View SolutionA graph is given below. Analyse the graph and answer the questions. a. What is the trend of atomic radius in this group?
'(##VPU_HSS_CHE_XI_C03_E02_025_Q01##)'
b. How can we use the graph to predict the trend of 'Li, H' in this group?
c. How can we use the graph to study the reactivity of elements of the group?
View SolutionAnalyse the graphs given below. (a) Which graph indicates uniform velocity? (b) Which graph indicates non uniform acceleration? (c) Which graph indicates the motion of a freely falling stone?
'(##VPU_TTT_IX_PHY_C02_E02_007_Q01##)'
View SolutionWhich graph correctly describes a trend found in the halogen group ?
View SolutionA graph is given below. Analyse the graph find the trend of atomic radius in this group.
View Solution
