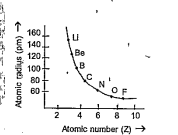
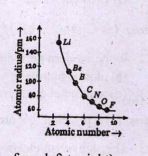
A graph of atomic radius versus atomic number is given below.
Using the above graph, how will you accoun for the variation of ionization enthalpy in a period?
 Solution in Malayalam
Step by step video & image solution for A graph of atomic radius versus atomic number is given below. Using the above graph, how will you accoun for the variation of ionization enthalpy in a period? by Chemistry experts to help you in doubts & scoring excellent marks in Class 11 exams.
Similar Questions
A graph of aromic radius versus atomic number is given blow: Using the above graph, how will you account for the varitation of inoisation enthalpy in a period.
 01:49View Solution
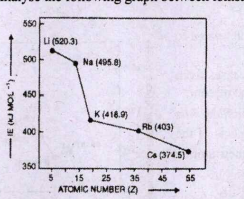
Analyse the following graph between ionisation enthalpy and atomic number.
 02:07View Solution
Ionization enthalpy and atomic radius are closely related properties. Analyse the following graph: What conculation can you derive from the graph regarding the first ionization enthalpies of alkali metals and noble gases ? Justyfy.
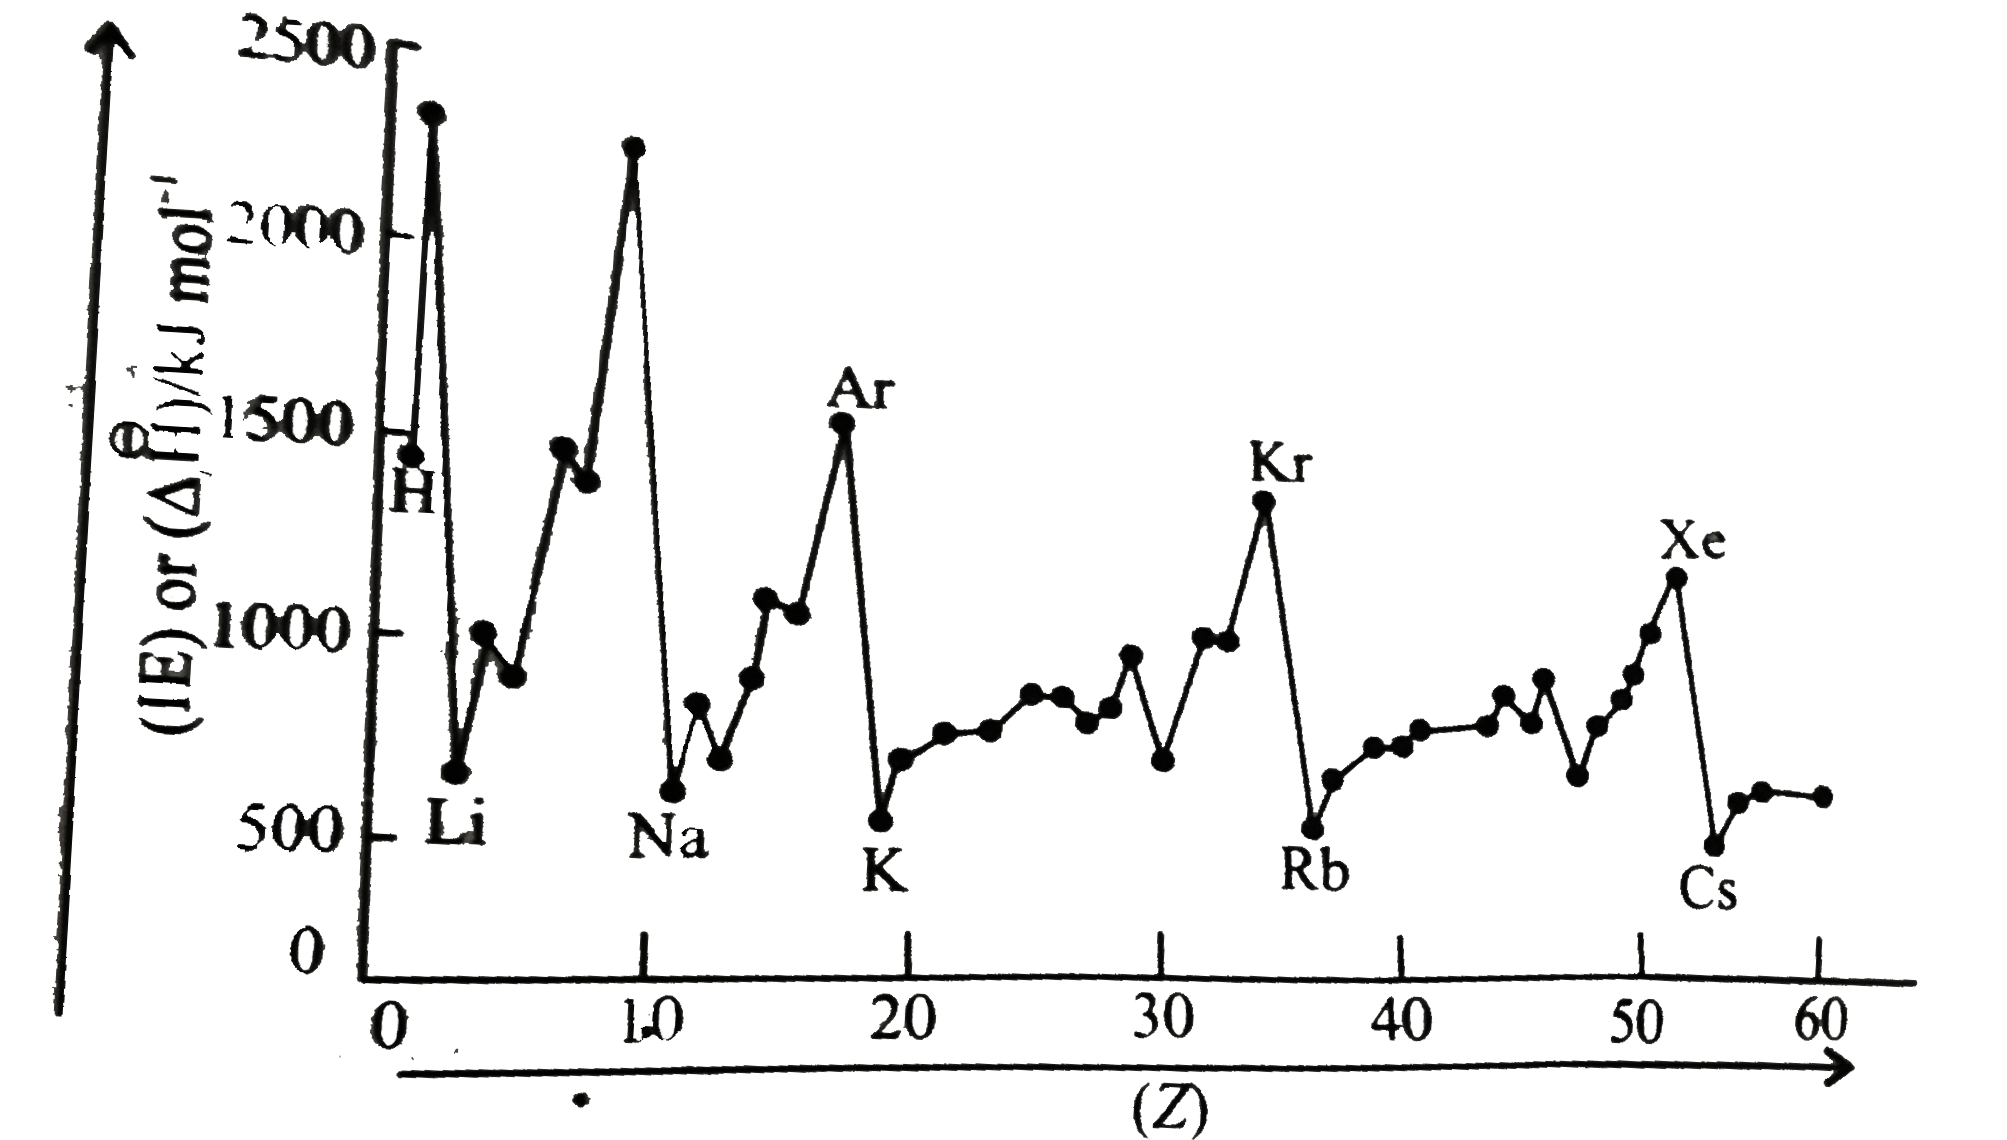
02:29View SolutionThe graph of IE1 or Δ1Hɵ1 versus atomic number (Z) is given below:

Which of the following statement is correct ?01:27View SolutionFollowing graph shows variation of ionization energies with atomic number in second period (Li -Ne) . Value of ionization energies of Na(11) will be-
04:01View SolutionA graph is given below. Analyse the graph find the trend of atomic radius in this group.
02:25View SolutionThe reactivity of an element is very much related to its ionization enthalpy. Observe the following graph in which the first ionization enthalpies (DeltaH_1) of elements of the second period are plotted against their atomic numbers (Z): Identify the anomalour values and justify.
05:46View SolutionA graph of atomic radius versus atomic number is given below. What do you understand from this graph?
05:06View Solution
