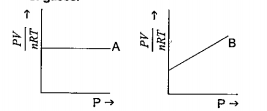
The following raphs are obtained for He at different conditions.
The graph A is drawn at high temperature and low pressure and graph B is drawn at low temperature and high pressure.
Which graph represents ideal behaviour?
 Solution in Malayalam
Step by step video & image solution for The following raphs are obtained for He at different conditions. The graph A is drawn at high temperature and low pressure and graph B is drawn at low temperature and high pressure. Which graph represents ideal behaviour? by Chemistry experts to help you in doubts & scoring excellent marks in Class 11 exams.
Similar Questions
A gas behaves more closely as an ideal gas at (a)low pressure and low temperature. (b)low pressure and high temperature (c) high pressure and low temperature (d) high pressure and high temperature
02:22View SolutionUnder which of the following sets of conditions is a real gas expected to deviate from ideal behaviour? (I) High pressure, small volume (II) High temperature , low pressure (III) Low temperature, high pressure
03:36View Solution(A) : A gas behaves more closely as an ideal gas at low pressure and high temperature. ( R) : Boyle's law is valid at low pressure and high temperature.
02:22View SolutionReal gases behave ideally at low temperature and high pressure. b) Justify.
01:34View SolutionHaber 's process N_(2)+H_(2) hArr______+Delta Temperature _______ Pressure ________ Catalyst ________ Favourable conditions : ______[temperature (high/low)] _________[pressure (high/low)]
02:40View SolutionA: A real gas will approach ideal behaviour at high temperature and low pressure.
R: At low pressure and high temperature z = 1, for all gases03:01View SolutionA high pressure and low temperature attractive forces between molecules become significant, the volume of a real gas is less than that of an ideal gas. Comment on the fact that there is a deviation from ideal behaviour at high pressure and low temperature.
03:13View Solution
