Study the following graph and based on that answer the questions with a suitable reason. The graph represents the various stages involved in step-wise change of ice to steam.
(a) Identify the stages associated with increase in temperature. Give a reason.
(b) In which stages, the temperature is constant? Why so?
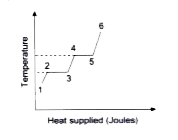
(a) In the graph, parts 1 to 2, 3 to 4 and 5 to 6 show heating of solid, liquid and gas, respectively which increases kinetic energy, and hence, there is rise in temperature.
(b) The parts 2 to 3 and 4 to 5 represent melting of solid and boiling of liquid. At these points the heat energy supplied is utilised for decreasing the intermolecular force of attraction, and hence, there is no change in temperature.
Similar Questions
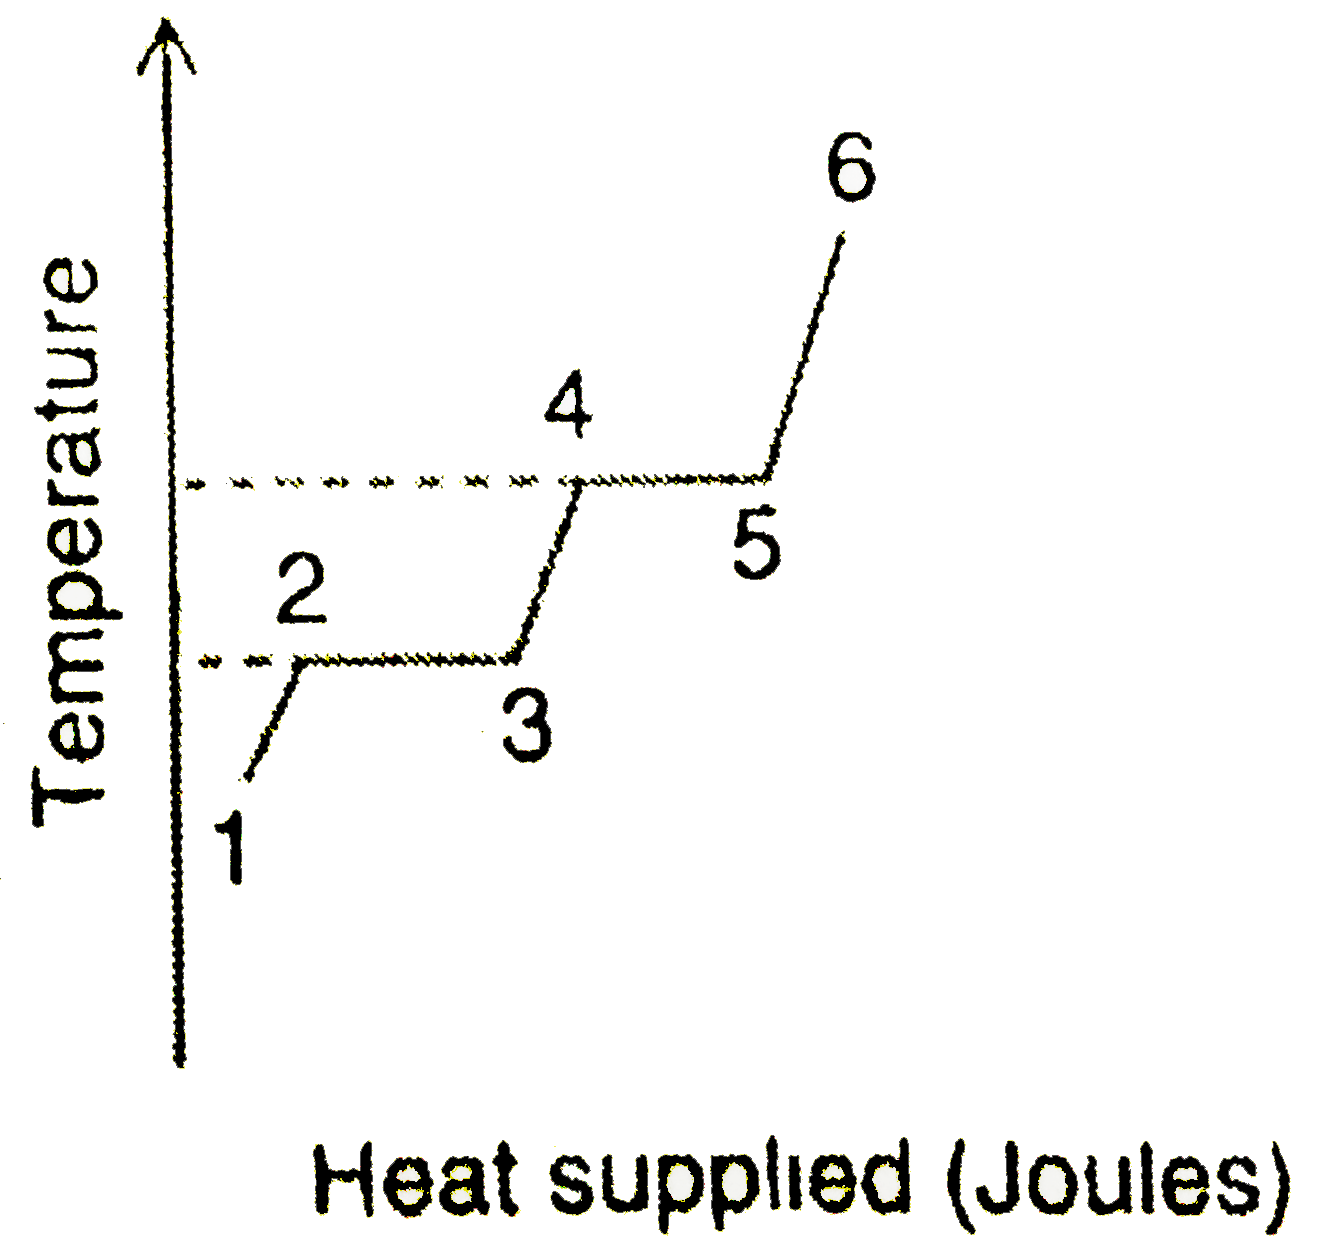
Study the following graph and based on that answer the questions with suitable reason. The graph represents the various stages inveolved in step wise change of ice to steam.
(a) Identify the stages associated with increase in temperature. Give reason.
(b) In which stages, the temperature is constant? Why?
View SolutionStudy the figure given below and answer the questions that follows- (a) Name the stage of human embryo the figure represents.(b) Identify A and B in the figure and mention its function.(c) Where is stem cell located in this embryo?
View Solution
Knowledge Check
Study the following Bar Graph and answer the questions. The Bar Graph gives the annual rates of inflation in percentage for 1975 and 1987.
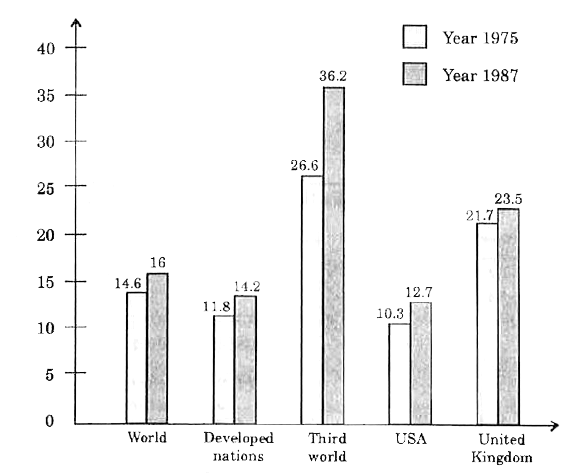
The change in rate of inflation was least in which of the following ?ADeveloped NationsBUnited KingdomCWorldDThird world
Given diagram representing a stage during mitotic cell division in an animal cell:
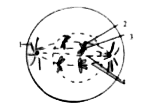
Identify the above stage. Give a reason to support your answer.
View SolutionGiven below is a diagram representing a stage during mitotic cell division in an animal cell:
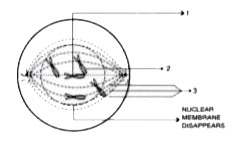
Identify the above stage। Give a reason to support your answer.
View SolutionStudy the diagram given below and answer the questions that follow:
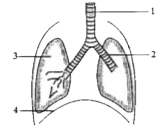
Which stage of pulmonary ventilation is shown in this diagram ? Give reason in support of your answer.
View SolutionThe following line graph shows the change in temperature of a block of ice when heated.
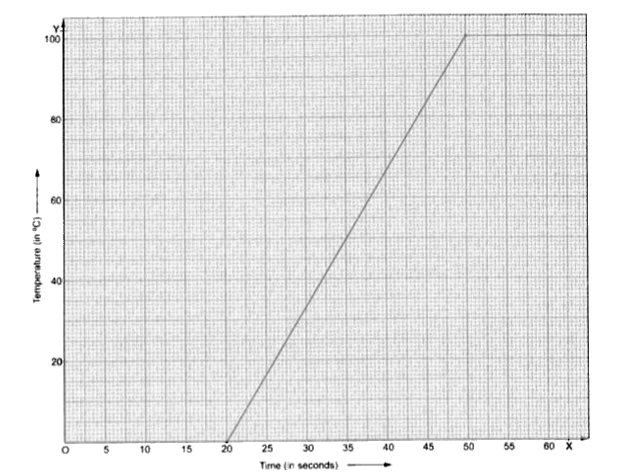
Study the above graph carefully and answer the questions given below :
(i) For how many seconds did the ice block have no change in temperature?
(ii) For how long was there a change in temperature?
(iii) After how many seconds of heating did the temperature become constant at 100∘C ?
(iv) What was the temperature after 25 seconds?
(v) What will be the temperature after 1.5 minutes ? Justify your answer.
View SolutionObserve the graph given below and answer the following questions:
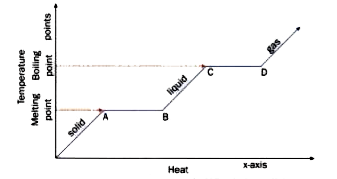
During melting of a solid, certain amount of heat is absorbed without any change in temperature. Which part of the graph shows this change?
View SolutionThe graph shows the maximum temperatures recorded for two consecutive weeks of a town. Study the graph and answer the questions that follow.
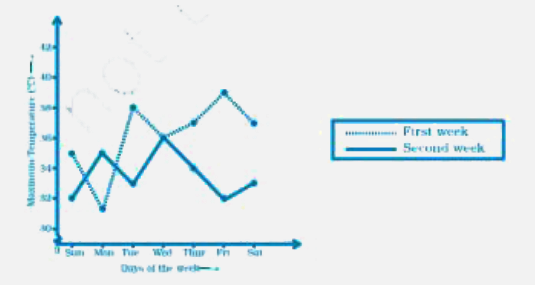
(a) What information is given by the two axes?
(b) In which week was the temperature higher on most of the days?
(c) On which day was the temperature same in both the weeks?
(d) On which day was the difference in temperatures the maximum for both the weeks?
(e) What were the temperatures for both the weeks on Thursday?
(f) On which day was the temperature 35°C for the first week?
(g) On which day was the temperature highest for the second week?
View SolutionStudy the given aquatic food chain and answer the questions that follow:

(i) Give reasons why there is a continuous increase in the DDT content in different trophic levels of the chain.
(ii) Name the phenomenon responsible for the increase in DDT content.
View Solution
