The table given shows the ratio of cars and bikes manufactured by 5 different companies. The table also shows the ratio of three different types of cars C1, C2 and C3 and three types of bikes B1, B2 and B3 manufactured by these 5 different companies. Total numbers of cars and bikes together manufactured by D, E, F, G and H are 300,000, 280,000, 320,000, 400,000 and 480,000 respectively.
नीचे दी गई तालिका, 8 विभिन्न कंपनियों द्वारा उत्पादित गाड़ियों तथा बाईकों के अनुपात को दर्शाती है। यह तालिका इन 5 कंपनियों द्वारा उत्पादित तीन प्रकार की C1, C2 तथा C3 एवं तीन प्रकार की बाइकों B1, B2 तथा B3 के अनुपात को भी दर्शाता है। D, E, F, G तथा H द्वारा उत्पादित गाड़ियों तथा बाइकों की मिलकर कुल संख्या क्रमशः 300000, 280000, 320000, 400000 तथा 480000 है।
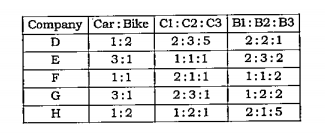 What is the average of the total number of cars of type C1 manufactured by the given 5 companies?
दी गई 5 गई कंपनिया द्वारा उत्पादित C1 प्रकार की गाड़िया की कुल संख्या का औसत क्या है?
58000
60000
56000
62000
Step by step video & image solution for The table given shows the ratio of cars and bikes manufactured by 5 different companies. The table also shows the ratio of three different types of cars C1, C2 and C3 and three types of bikes B1, B2 and B3 manufactured by these 5 different companies. Total numbers of cars and bikes together manufactured by D, E, F, G and H are 300,000, 280,000, 320,000, 400,000 and 480,000 respectively. नीचे दी गई तालिका, 8 विभिन्न कंपनियों द्वारा उत्पादित गाड़ियों तथा बाईकों के अनुपात को दर्शाती है। यह तालिका इन 5 कंपनियों द्वारा उत्पादित तीन प्रकार की C1, C2 तथा C3 एवं तीन प्रकार की बाइकों B1, B2 तथा B3 के अनुपात को भी दर्शाता है। D, E, F, G तथा H द्वारा उत्पादित गाड़ियों तथा बाइकों की मिलकर कुल संख्या क्रमशः 300000, 280000, 320000, 400000 तथा 480000 है। What is the average of the total number of cars of type C1 manufactured by the given 5 companies? दी गई 5 गई कंपनिया द्वारा उत्पादित C1 प्रकार की गाड़िया की कुल संख्या का औसत क्या है? by Maths experts to help you in doubts & scoring excellent marks in Class 14 exams.
Updated on:21/07/2023Topper's Solved these Questions
Similar Questions
The table given shows the ratio of cars and bikes manufactured by 5 different companies. The table also shows the ratio of three different types of cars C1, C2 and C3 and three types of bikes B1, B2 and B3 manufactured by these 5 different companies. Total numbers of cars and bikes together manufactured by D, E, F, G and H are 300,000, 280,000, 320,000, 400,000 and 480,000 respectively.
नीचे दी गई तालिका, 8 विभिन्न कंपनियों द्वारा उत्पादित गाड़ियों तथा बाईकों के अनुपात को दर्शाती है। यह तालिका इन 5 कंपनियों द्वारा उत्पादित तीन प्रकार की C1, C2 तथा C3 एवं तीन प्रकार की बाइकों B1, B2 तथा B3 के अनुपात को भी दर्शाता है। D, E, F, G तथा H द्वारा उत्पादित गाड़ियों तथा बाइकों की मिलकर कुल संख्या क्रमशः 300000, 280000, 320000, 400000 तथा 480000 है।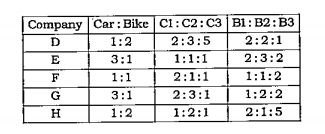 What is the difference between the total number of C3 type car manufactured by company E and G together and the number of bikes of type B1 manufactured by company H?
कंपनी E तथा G द्वारा मिलाकर उत्पादित C3 प्रकार की गाडिया की कुल संख्या तथा कंपनी H द्वारा उत्पादित B1 प्रकार की बाईको को संख्या के मध्य अंतर क्या है?
View SolutionThe table given shows the ratio of cars and bikes manufactured by 5 different companies. The table also shows the ratio of three different types of cars C1, C2 and C3 and three types of bikes B1, B2 and B3 manufactured by these 5 different companies. Total numbers of cars and bikes together manufactured by D, E, F, G and H are 300,000, 280,000, 320,000, 400,000 and 480,000 respectively.
नीचे दी गई तालिका, 8 विभिन्न कंपनियों द्वारा उत्पादित गाड़ियों तथा बाईकों के अनुपात को दर्शाती है। यह तालिका इन 5 कंपनियों द्वारा उत्पादित तीन प्रकार की C1, C2 तथा C3 एवं तीन प्रकार की बाइकों B1, B2 तथा B3 के अनुपात को भी दर्शाता है। D, E, F, G तथा H द्वारा उत्पादित गाड़ियों तथा बाइकों की मिलकर कुल संख्या क्रमशः 300000, 280000, 320000, 400000 तथा 480000 है।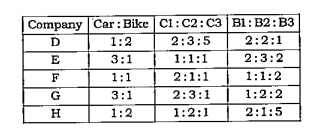 H= Total number of B2 type bike manufactured by all the companies. R=Total number of C1 type car manufactured by company F, G and D together. What is the value of H/R?
H= सभी कंपनिया द्वारा उत्पादित B2 प्रकार की बाईको की कुल संख्या। R= कंपनी F,G तथा D द्वारा मिलाकर उत्पादित C1 प्रकार की गाडिया की कूल संख्या H/R का मान क्या है?
View Solution
Knowledge Check
The Table shows the Number of Laptops and Desktops manufactured by a company.

What was the difference in the total number of Laptops and Desktops manufactured in 2009 to the total number if Laptops and Desktops manufactured in 2011 ?A6800B5600C8600D8200The table shows the production of different types of cars
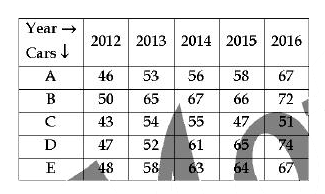
The average production of type A cars during the five years is what percent of the total production of type C cars during the five years?A22.4B20.6C21.8D18.7The table shows the production of different types of cars ( in thousands).
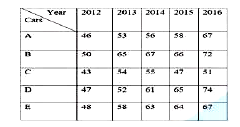
What is the ratio of the total production of type C and D cars in 2012 to the total production of type A cars in 2014 and type E cars in 2015?AA) 5:6BB) 9:11CC) 3:4DD) 11:12
The table given shows the ratio of cars and bikes manufactured by 5 different companies. The table also shows the ratio of three different types of cars C1, C2 and C3 and three types of bikes B1, B2 and B3 manufactured by these 5 different companies. Total numbers of cars and bikes together manufactured by D, E, F, G and H are 300,000, 280,000, 320,000, 400,000 and 480,000 respectively.
नीचे दी गई तालिका, 8 विभिन्न कंपनियों द्वारा उत्पादित गाड़ियों तथा बाईकों के अनुपात को दर्शाती है। यह तालिका इन 5 कंपनियों द्वारा उत्पादित तीन प्रकार की C1, C2 तथा C3 एवं तीन प्रकार की बाइकों B1, B2 तथा B3 के अनुपात को भी दर्शाता है। D, E, F, G तथा H द्वारा उत्पादित गाड़ियों तथा बाइकों की मिलकर कुल संख्या क्रमशः 300000, 280000, 320000, 400000 तथा 480000 है।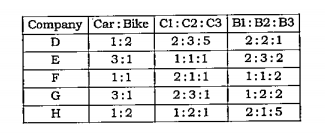 A= Total number of cars manufactured by all the companies. K =Difference between the number of C3 type cars manufactured by company H and the number of B3 type bike manufactured by company E. What is the value of A:K?
A= सभी कंपनिया द्वारा उत्पादित गाड़ियों की कुल संख्या। K= कंपनी H द्वारा उत्पादित C3 प्रकार की गाड़ियों की संख्या तथा कंपनी E द्वार उत्पादित B3 प्रकार की बाईको को संख्या के बीच का अंतर। A:K का मान क्या है?
View SolutionWhat will be the trend percentage , if the Inventory of a firm is ₹ 2,00,000, ₹ 2,40,000 , ₹ 3,00,000 and ₹ 4,00,000 respectively ?
View SolutionThe table given below shows production of five types of cars by a company from the 1998 to 2003. Study the table and answer the questions.
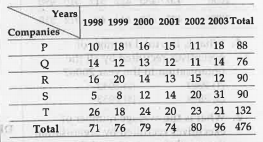
Which company produced the highest number of cars in all the years together?
View SolutionThe pie chart given below shows sale of different types of cars in a city for a given year. The total sale of cars in the city is 6,00,000.
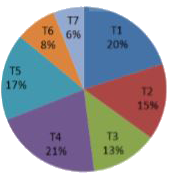
What is the difference in the number of cars sold of type T5 and T1?
View SolutionThe table shows the production of different types of cars (in thousands)
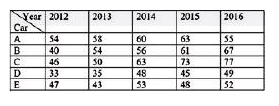
The total production of all types of cars , except type B, in 2012 is what percent less than the total production of all types of cars in 2016?
View Solution