The following bar-diagram shows total number of males and females in five different organisations. Study it carefully to answer the questions.
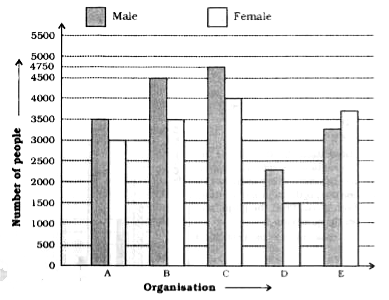
By how much percentage is the average number of females from all the organisations together is more than the number of males in organisation 'D'?
0.3
0.38
0.4
0.45
Step by step video & image solution for The following bar-diagram shows total number of males and females in five different organisations. Study it carefully to answer the questions. By how much percentage is the average number of females from all the organisations together is more than the number of males in organisation 'D'? by Maths experts to help you in doubts & scoring excellent marks in Class 14 exams.
Updated on:21/07/2023Topper's Solved these Questions
Similar Questions
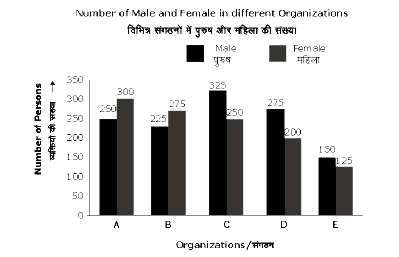
In the given bar graph, what is the average number of females in all five organisation.
View SolutionDirections: The following bar graph shows the number of pages in five different books (viz. A, B, C, D and E). Study the graph carefully and answer the following questions.
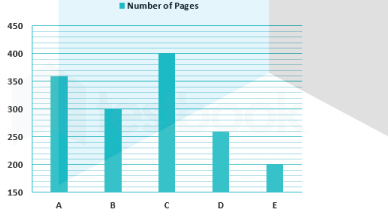
What is the ratio of total number of pages in book B and E together to the total number of pages in book C and D together?
View Solution
Knowledge Check
The following bar-diagram shows total number of males and females in five different organisations. Study it carefully to answer the questions.
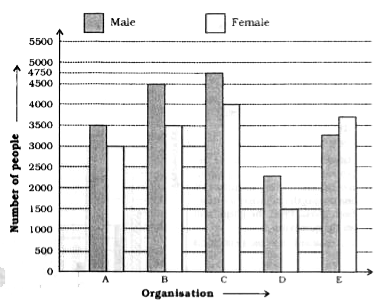
What is the ratio of average number of females from the organisations A, B and C to the average number of males from the organisations C, D and E?A42:41B41:42C40:41D41:40The following bar-diagram shows total number of males and females in five different organisations. Study it carefully to answer the questions.
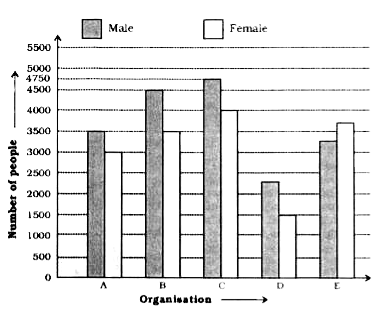
What is the ratio of the number of females from the organisations B and C to the number of males from the organisations D and E?A12:11B12:15C11:15D15:11The following bar-diagram shows total number of males and females in five different organisations. Study it carefully to answer the questions.
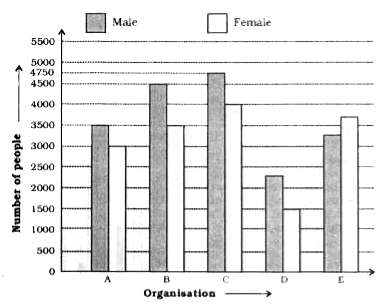
What is the difference between the total number of females and the total number of males from all the organisations together?A2005B2050C2500D2055
Following table shows the number of students studying in four different schools in four years. Studying the table carefully and answer the questions that follow
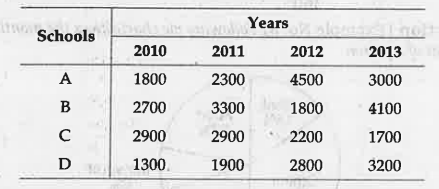
What is the total number of students studying in all the four schools together in the year 2012?
View SolutionThe following bar-diagram shows total number of males and females in five different organisations. Study it carefully to answer the questions.
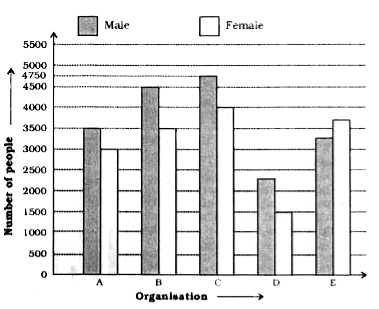
Males from organisations A and B together form what per cent of total number of males from organisations C, D and E together?
View SolutionIn the given bar graph, what is the average number of females in all five organisations?
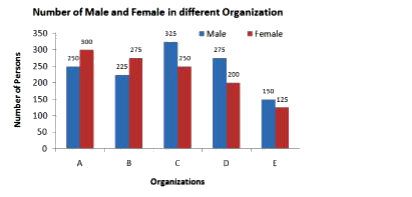
View SolutionStudy the following bar hraph carefully and answer the questions.
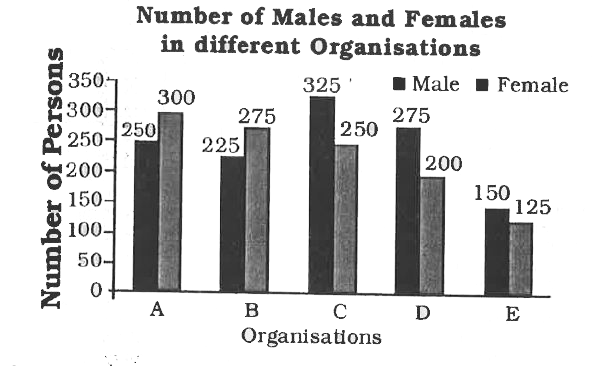
In the given bar graph, what is the average number of females in all five organisations?
View SolutionDirections (Q. Nos. 1 - 5) Study the following graph and pie chart carefully and answer the Questions that follow.
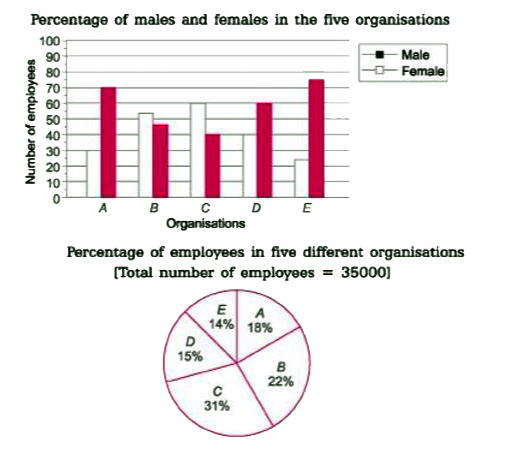
. What is the total number of males in all the organisations together?
View Solution
