In a frequency distribution, ogives are graphical representation of-
एक बारंबारता बंटन में, ओजाइव किसका लेखाचित्र प्रस्तुत करते हैं?
Frequency / बारंबारता
Relative frequency /सापेक्ष बारंबारता
Cumulative frequency/ संचयी बारंबारता
Raw data/कच्चे आँकड़े
Step by step video & image solution for In a frequency distribution, ogives are graphical representation of- एक बारंबारता बंटन में, ओजाइव किसका लेखाचित्र प्रस्तुत करते हैं? by Maths experts to help you in doubts & scoring excellent marks in Class 14 exams.
Updated on:21/07/2023Topper's Solved these Questions
Similar Questions
There are 70 students in a class, of them 50 students like cricket, 35 like both cricket and football, and some like only football. Select the venn diagram that correctly represents the given information.
एक कक्षा में 10 छात्र हैं, उनमें से 50 छात्र क्रिकेट पसंद करते है, 35 क्रिकेट और फुटबॉल दोनों पसंद करते हैं और कुछ केवल फुटबॉल पसंद करते हैं। वेन आरेख का चयन करें जो दी गई जानकारी को सही ढंग से प्रस्तुत करता है।
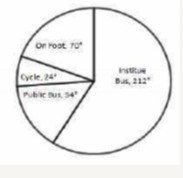
View SolutionStudy the pie-chart and answer the questions. In an institute, there are 900 students who use different modes of transport for to and from travel. The given pie diagram represents the requisite data.
पाई-चार्ट का अध्ययन करें और प्रश्नों के उत्तर दें। एक संस्थान में, 900 छात्र हैं जो आने-जाने के लिए परिवहन के विभिन्न साधनों का उपयोग करते हैं। दिए गए पाई चार्ट में संबंधित आंकड़े दिए गए हैं। The number of students who travel on foot is:
पैदल यात्रा करने वाले छात्रों की संख्या है:
View Solution
Knowledge Check
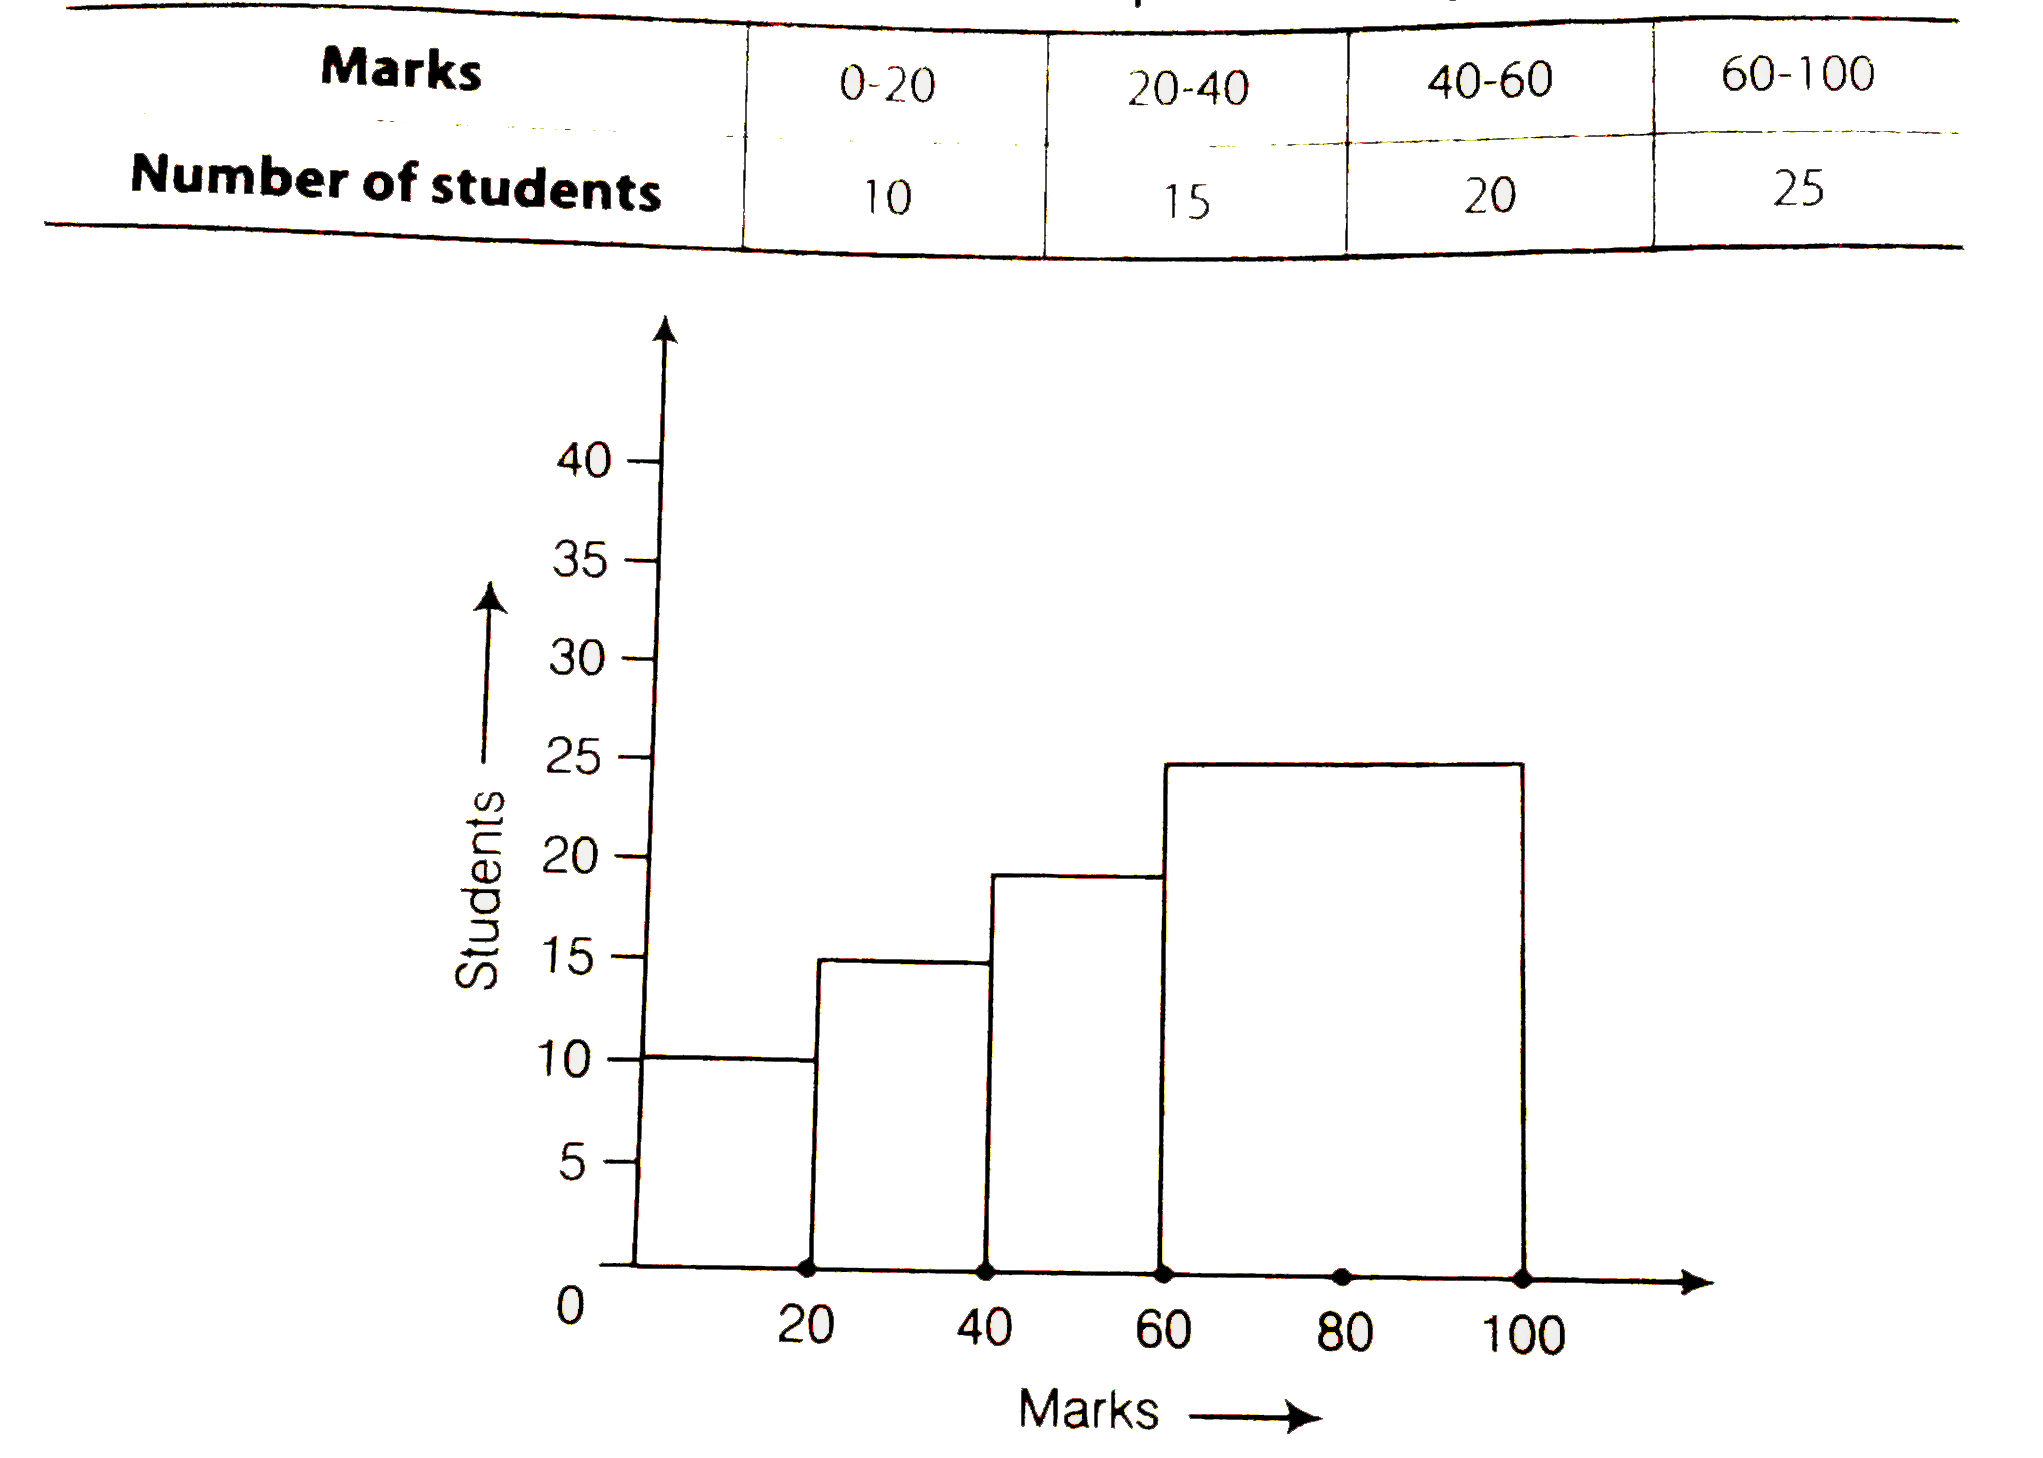
The frequency distributions been represented graphically as follows.

Is this representation correct?AYesBNoCcannot sayDNoneभाषा शिक्षक के रूप में आपके लिए महत्वपूर्ण है
Aसमय-सिमा के भीतर भाषा का पाठ्यक्रम पूर्ण करनाBसमय-सिमा के भीतर पाठ्य-पुस्तक पूर्ण करनाCबच्चों का भाषा के विविध स्वरूपों और प्रयोगों से परिचयDबच्चों द्वारा भाषा परीक्षाओं में अच्छे अंक लानाWhich of the following can be passed through while travelling through Malaka Strait?
मलक्का के जलडमरूमध्य से यात्रा करते हुए निम्नलिखित में से किस एक से होकर गुजर सकते हैं?ABali / बालीBBrunei/ ब्रुनेईCJava / जावाDSigapore / सिंगापुर
The median of a given frequency distribution is found graphically with the help of (a) Histogram (b) Frequency curve (c) Frequency polygon (d) Ogive
View SolutionThe mode of a frequency distribution can be determined graphically from (a) Histogram (b) Frequency polygon (c) Ogive (d) Frequency curve
View SolutionConsider the following statements in respect of histogram :
1. Histogram is an equivalent graphical representation of the frequency distribution.
2. Histogram is suitable for continuous random variables, where the total frequency of an interval is evenly distributed over the interval.
What of the statements given above is/are correct?
View SolutionWorking alone A can do a work in 72 days and B in 90 days. If they work on it together for 10 days, then what fraction of work is left?
A अकेले कार्य करते हुए 72 दिनों में एक काम कर सकता है और B उसे 90 दिनों में कर सकता है। यदि वे 10 दिनों तक एक साथ उस काम को करते हैं, तो काम का कितना अंश बच जाता है?
View SolutionSmith and Ajit can complete a task in 12 days and 18 days respectively. If they work together on a task for 4 days, then the fraction of task that will be left is:
स्मिथ और अजीत क्रमशः 12 दिनों और 18 दिनों में एक कार्य पूरा कर सकते हैं। यदि वे 4 दिनों के लिए एक कार्य पर एक साथ कार्य करते हैं, तो जो कार्य शेष होगा वह है:
View Solution
