A diagram that shows the relationship between two variables is called
A
Mean
B
Scatter diagram
C
Map
D
Median
Text Solution
The correct Answer is:B
|
Similar Questions
Knowledge Check
Correlation between two variables is
AProof of relationship between two variables.BSimply some pointer of relationship between two variables.CNeither (a) nor (b)DEither (a) or (b)Correlation between two variables may be
ApositiveBnegativeCboth A and BDnone of the aboveCorrelation between two variables may be
APositiveBNegativeCEitherDNone of these
the relation between two or more variables is called a _____
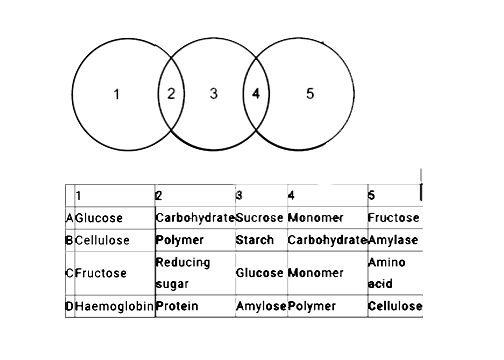
View SolutionThe diagram shows the relationship between some biological molecules.
Which row is correct for this relationship?

View SolutionSelect the diagram that shows the best relationship between the given categories.
Uncle, Relative, Rich
View SolutionThe relationship between a cow and a snake is called :
View SolutionCorrelation indicates a joint relationship between two variables' is said by
View Solution
