The most appropriate diagram to represent the data relating to the monthly total expenditure by a family is
Pie diagram
Bar diagram,
Line diagram
Multiple bar diagram.
The correct Answer is:A
Similar Questions
Following table shows the monthly expenditure of Imran’s familyon various items.
View SolutionThe following data gives the distribution of total monthly household expenditure of 200 families of a village. Find the modal monthly expenditure of the families. Also, find the mean monthly expenditure:
View Solution
Knowledge Check
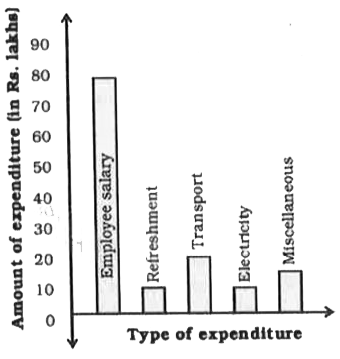
The bar diagram shows the monthly expenditure of a company. Study the graph and answer the questions.

The total monthly expenditure of the company is :ARs. 153 lakhsBRs. 315 lakhsCRs. 135 lakhsDRs. 531 lakhsThe bar diagram shows the monthly expenditure of a company. Study the graph and answer the questions.

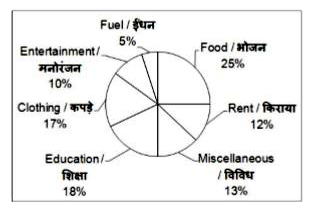
The total monthly expenditure of the company is :ARs. 153 lakhsBRs. 315 lakhsCRs. 135 lakhsDRs. 531 lakhsThe pie chart given below shows the monthly expenses on various heads of a family . The total expenditure of the family is Rs 30000.

What is the amount (in Rs) spent on food ?A2500B5000C7500D8000
The following data gives the distribution of total monthly household expenditure of 200 families of a village. Find the modal monthly expenditure of the families. Also, find the mean monthly expenditure:
View SolutionThe following data gives the distribution of total monthly household expenditure of 200 families of a village. Find the modal monthly expenditure of the families. Also, find the mean monthly expenditure: Expenditure (Rs.) Frequency Expenditure (Rs.) Frequency 1000-1500 24 3000-3500 30 1500-2000 40 3500-4000 22 2000-2500 33 4000-4500 16 2500-3000 28 4500-5000 7
View SolutionThe monthly expenditure of a family o 9 members is Rs 891. What will be the montly expenditure of the family, if there are 12 members?
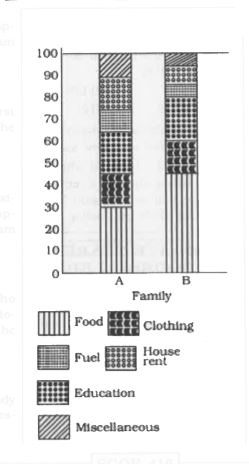
View SolutionStudy the diagram and answer the questions.

What fraction of the total expenditure is spent on Education in family A?
View SolutionThe monthly family expenditure (in %) on n different items are follows

if the total monthly expenditure is Rs 9000, then what is the expenditure on transport.
(a)Rs180
(b)Rs1000
(c)Rs900
(d)Rs360
View Solution
