The graph showing a time series is called
A
Historigram
B
Ogive
C
Hictogram
D
Polygon
Text Solution
The correct Answer is:A
|
Similar Questions
Knowledge Check
The graph of Time Series is called
APeriodic chartBFinancial chartCHistogramDPie chart.While drawing time series graph X-axis has-
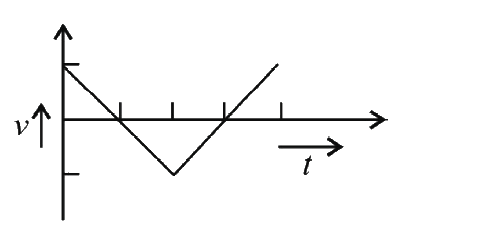
ATimeBIncomeCExpenditureDAll of these.The graph in figure shows the velocity v versus time t for a body. Which of the graphs shown in figure represents the corresponding acceleration versus time graphs ?
 A
A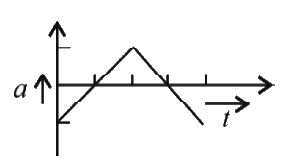 B
B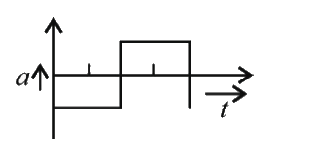 C
C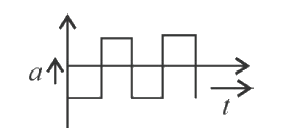 D
D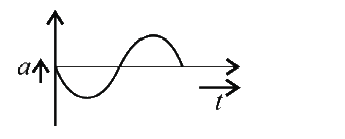
The graph in figure shows the velocity v versus time t for a body. Which of the graphs shown in figure represents the correesponding acceleration versus time graphs ?

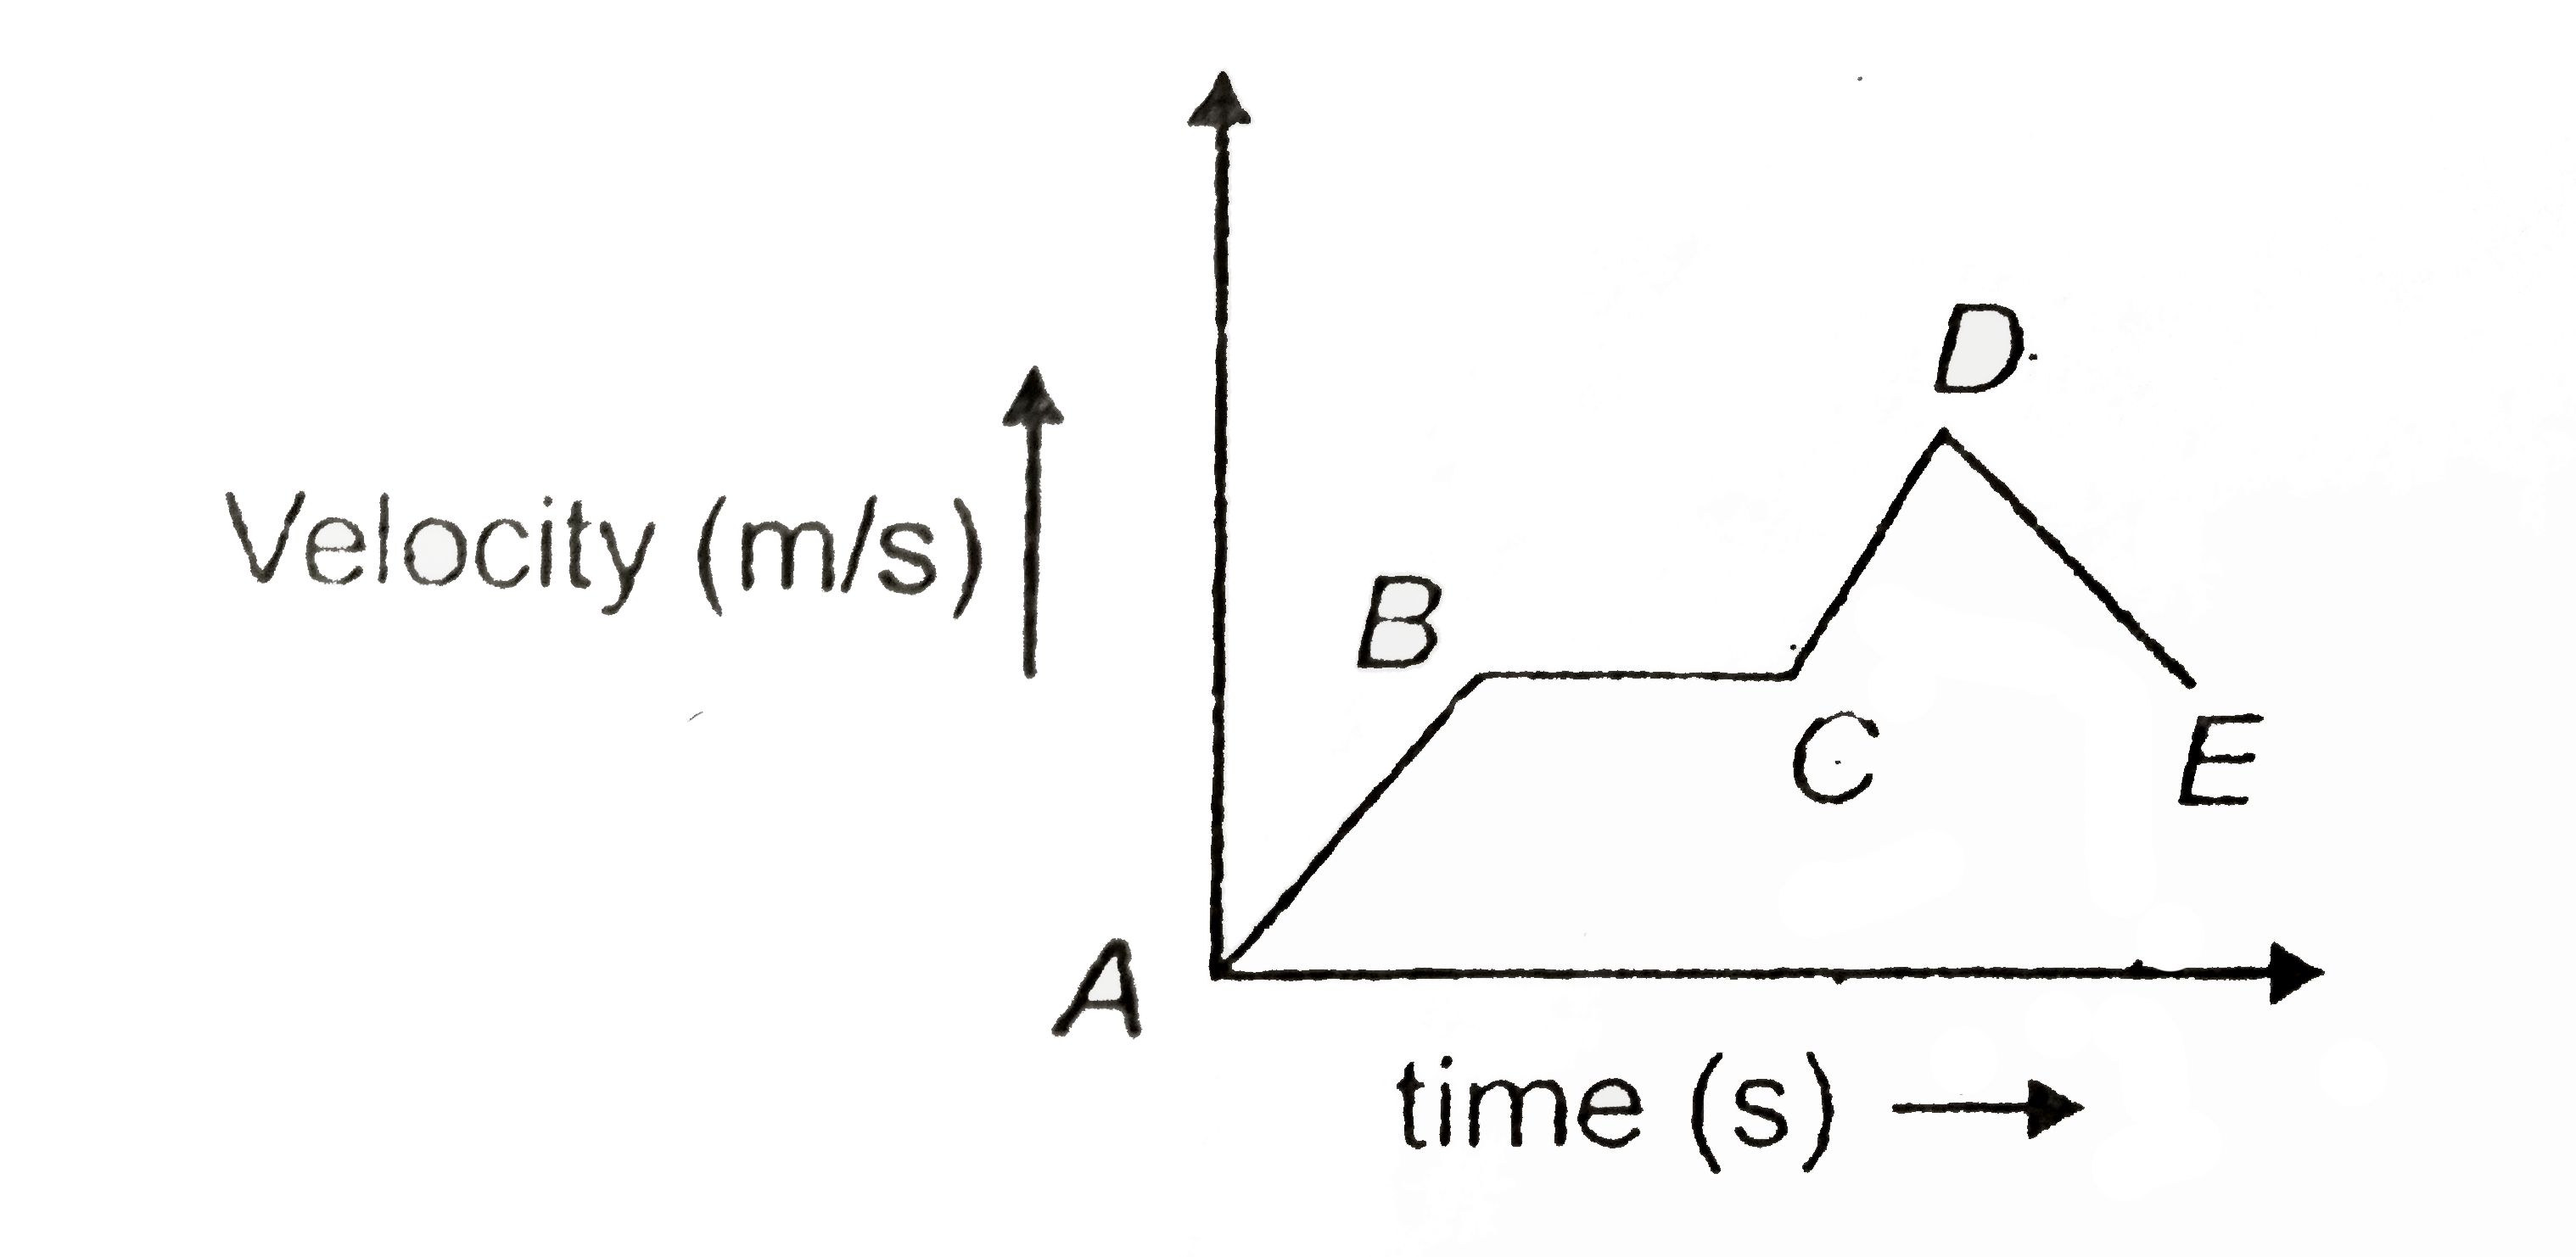
View SolutionThe velocity-time graph of an object is shown below. The part of the graph showing zero acceleration is
View SolutionThe graph shows the variation of displacement of a particle execting SHM with time . We infer from this graph that
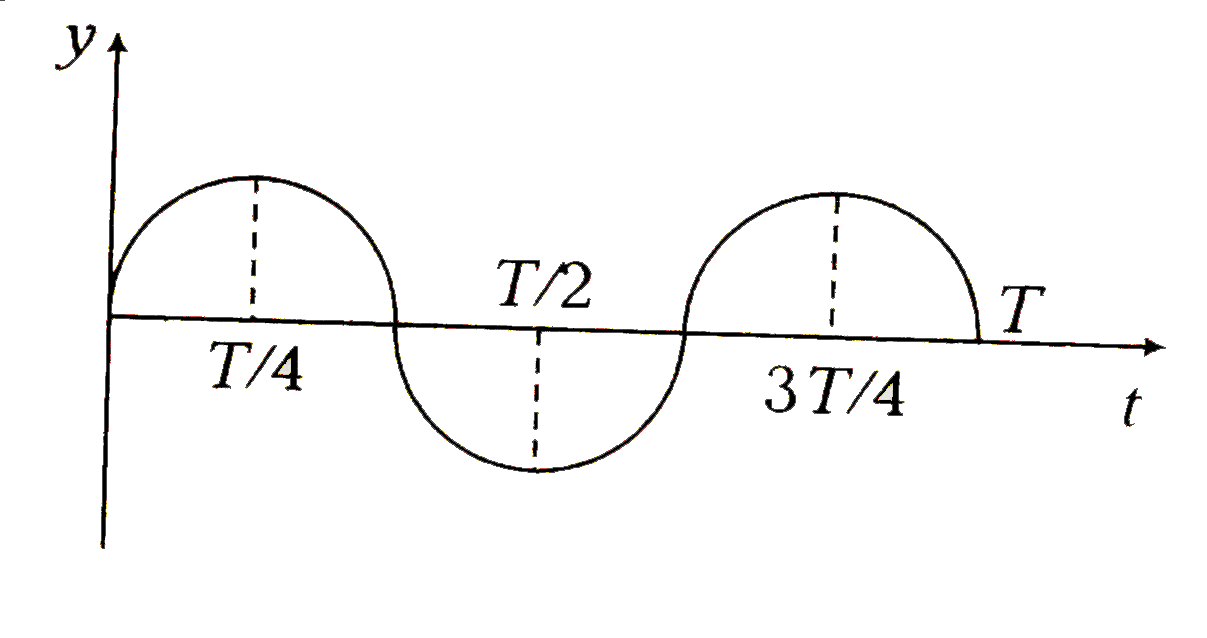
View SolutionThe graph shows the variation of displacement of a particle executing S.H.M with time. We inference form this graph that :-
_E01_037_Q01.png)
View SolutionThe graph shows the variation of displacement of a particle executing SHM with time . We infer from this graph that

View Solution
