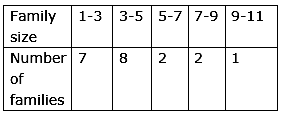
A survey conducted on 20 households in a locality by a group of students resulted in the following frequency table for the number of family members in a household.

Find the mode of this data.Solution in Telugu
Step by step video & image solution for A survey conducted on 20 households in a locality by a group of students resulted in the following frequency table for the number of family members in a household.Find the mode of this data. by Maths experts to help you in doubts & scoring excellent marks in Class 10 exams.
Updated on:21/07/2023Topper's Solved these Questions
- STATISTICSBOOK - BEYOND PUBLICATIONCHAPTER - STATISTICSEXERCISE - EXERCISE
141 Videos
- SIMILAR TRIANGLESBOOK - BEYOND PUBLICATIONCHAPTER - SIMILAR TRIANGLESEXERCISE - EXERCISE
143 Videos
- TANGENTS AND SECANTS TO CIRCLEBOOK - BEYOND PUBLICATIONCHAPTER - TANGENTS AND SECANTS TO CIRCLEEXERCISE - EXERCISE
157 Videos
Similar Questions
The median of the data x/5, x, x/4, x/2 and x/8 is 8. Find the value of x.
View SolutionIn △ABC, DE∣∣BC and AD=13BD.
If BC = 4.5cm, Find DE.
View SolutionA tangent to a circle intersects it in ………. Point (s) .
View SolutionA survey conducted on 20 households in a locality by a group of students resulted in the following frequency table for the number of family members in a household:Find the mode of this data.

View SolutionWhich of the following are correct chain isomers of butane ? (i)
View SolutionDetermine the point of symmetry of a regular hexagon.
View SolutionDtermine the images of the following figure about the given line :
View SolutionMatch the following Column A to Column B

View SolutionMatch the following Column A to Column B

View SolutionMatch the following Column A to Column B

View SolutionThe inequation represented by the graph given below is :
View SolutionThe inequation that best describes the graph given below is _________
View SolutionThe inequation that best describes the following graph is _________
View SolutionFind the magnitude of the resultant of shown forces :-
ltimg src="https://d10lpgp6xz60nq.cloudfront.net/physics_images/ALN_PHY_R02_E02_009_Q01.png" width="80%"gt
View SolutionA survey conducted on 20 households in a locality by a group of students resulted in the following frequency table for the number of famialy members in a household .
Family size Number of families1−373−585−727−929−111
Find the mode of this date.
View SolutionA survey conducted on 20 households in a locality by a group of students resulted in the following frequency table for the number of family members in a household.

Find the mode of this data.
View Solution
