The lengths of 40 leaves of a plant are measured correct to the nearest millimetre and the data obtained is represented in the following data:

Find the median length of the leaves
The data needs to be converted to continuous classes for findinig the median, since the formula assumes continuous classes. The classes then change to 117.5-126.5, 126.5-135.5,...........171.5-180.5)Solution in Telugu
Step by step video & image solution for The lengths of 40 leaves of a plant are measured correct to the nearest millimetre and the data obtained is represented in the following data:Find the median length of the leaves The data needs to be converted to continuous classes for findinig the median, since the formula assumes continuous classes. The classes then change to 117.5-126.5, 126.5-135.5,...........171.5-180.5) by Maths experts to help you in doubts & scoring excellent marks in Class 10 exams.
Updated on:21/07/2023Topper's Solved these Questions
- STATISTICSBOOK - BEYOND PUBLICATIONCHAPTER - STATISTICSEXERCISE - EXERCISE
141 Videos
- SIMILAR TRIANGLESBOOK - BEYOND PUBLICATIONCHAPTER - SIMILAR TRIANGLESEXERCISE - EXERCISE
143 Videos
- TANGENTS AND SECANTS TO CIRCLEBOOK - BEYOND PUBLICATIONCHAPTER - TANGENTS AND SECANTS TO CIRCLEEXERCISE - EXERCISE
157 Videos
Similar Questions
The median of the data x/5, x, x/4, x/2 and x/8 is 8. Find the value of x.
View SolutionIn △ABC, DE∣∣BC and AD=13BD.
If BC = 4.5cm, Find DE.
View SolutionA tangent to a circle intersects it in ………. Point (s) .
View SolutionThe lengths of 40 leaves of a plant are measured correct to the nearest millimetre, and the data obtained is represented in the following table :

Find the median length of the leaves.(Hint: The data needs to be converted to continuous classes for finding the median, since the formula assumes continuous classes. The classes then change to 117.5- 126.5,126.5 - 135.5,..171.5 -180.5.)
View SolutionMatch the following Column A to Column B

View SolutionThe inequation represented by the graph given below is :
View SolutionThe inequation that best describes the following graph is _________
View SolutionThe lengths of 40 leaves of a plant are measured correct to the nearest (millimeter, and the data obtained is represented in the following table
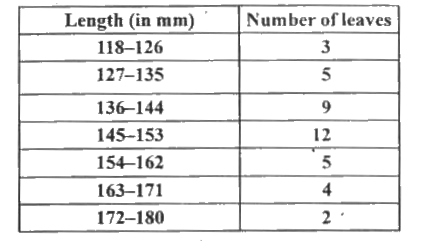
Find the median length of the leaves.
(Hint: The data needs to be converted to continuous classes for finding the median, since the formula assumes continuous classes. The classes then change to 117.5-126.5,126.5-135.5,...,171.5-180.5.)
View SolutionThe length of 40 leaves of a plant are measured correct to one millimetre, and the obtained data is represented in the following table :
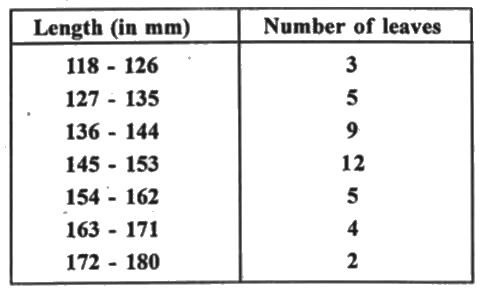
(ii) Is there any other graphical representation for the same data ?
View SolutionThe lengths of a plant's 40 leaves were measured to the nearest millimeter and the data obtained are represented in the table below. Find a matrix of leaf lengths. (Hint: You need to change the data to constant frequencies to find the timepiece because the formula is only for constant frequencies 117.5 - 126.5, 126.5 -135.5 ,,., 171.5 -180.5.)
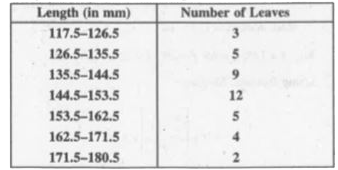
View SolutionThe lengths of 40 leaves of a plant are measured correct to the nearest millimeter and the data obtained is represented in the following table :
Find the median length of the leaves.
View SolutionFind the mode of the given data 3,5,4,6,5,4,5,7,5
View SolutionThe lengths of 40 leaves of a plant are measured correct to the nearest millimetre, and the data obtained is represented in the following table:
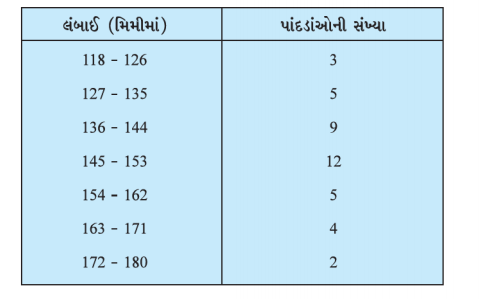
Find the median length of the leaves. (Hint: The data needs to be converted to continuous classes for finding the median , since the formula assumes continuous classes. The classes then change to 117.5-126.5, 126.5-135.5, .......171.5-180.5.)
View SolutionThe length of 40 leaves of a plant is measured correct to the nearest millimetre and the data obtained is represented in the following table. Find the mean length of the leaves.
View SolutionThe length of 40 leaves of a plant are measured correct to one millimetre, and the obtained data is represented in the following table.
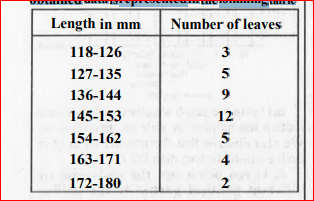 : Draw a histogram to represent the given data.
View SolutionThe length of 40 leaves of a plant are measured correct to one millimetre, and the obtained data is represented in the following table.
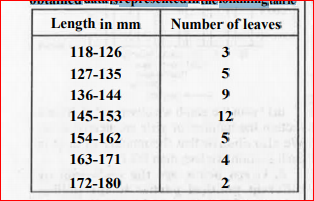 : Is there any other suitable graphical representation for the same data ?
View Solution

