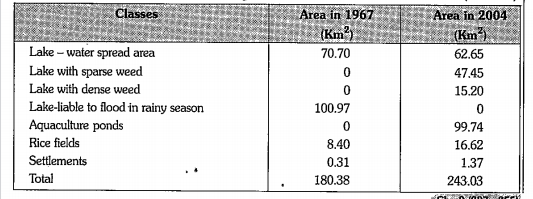
Obsere the data given in the following table.
How do the above reasons lead pollution ?
 Solution in Telugu
Step by step video & image solution for Obsere the data given in the following table. How do the above reasons lead pollution ? by Biology experts to help you in doubts & scoring excellent marks in Class 10 exams.
Updated on:21/07/2023Topper's Solved these Questions
- OUR ENVIRONMENTBOOK - BEYOND PUBLICATIONCHAPTER - OUR ENVIRONMENTEXERCISE - EXERCISE
83 Videos
- NUTRITION FOOD SUPPLYING SYSTEMBOOK - BEYOND PUBLICATIONCHAPTER - NUTRITION FOOD SUPPLYING SYSTEMEXERCISE - EXERCISE
184 Videos
- REPRODUCTION- THE GENERATING SYSTEMBOOK - BEYOND PUBLICATIONCHAPTER - REPRODUCTION- THE GENERATING SYSTEMEXERCISE - EXERCISE
168 Videos
Similar Questions
What does a food chain always start with?
View SolutionWhich of the following organisms take the food by parasitic nutrition ?
View SolutionRead the following passage and answer the following questions.
Rhizopus produces hundreds of microscopic reproductive units called spores .When the spare case bursts,the spores spreads into air .Under favourable condition like damp and warm condition .They germinate and produce new individuals.
What is the scientific name of fungi?
View SolutionThe following table given the daily income of 50 workers of a factory :

Find the mean, mode nad median of above data.
View SolutionHow does the buring of coal lead to air pollution as well as water pollution ?
View SolutionThe following data gives the number of children in 20 frequency table.
4,5,2,4,2,2,1,2,2,1,5,3,2,1,1,4,3,2,1,1
Make an array of the above data and construct a frequency table.
View SolutionFind the mean of the data given in the following table :

View SolutionHow does mining lead to pollution ?
View SolutionThe marks obtained by 60 students are given in the table The median of the above data is
View SolutionHow does air pollution lead to water pollution?
View Solutiondo factorires lead to pollution ?
View SolutionThe following table given the daily income of 50 workers of a factory :

Find the mean of above data.
View SolutionObsere the data given in the following table. In which year lake - water spread are is more ? Why ?
View SolutionObsere the data given in the following table.
How do you think weeds are more in the lake ?
View SolutionObsere the data given in the following table. What are th reasons for decrease in lake area ?
View Solution
