Collect any graph that shows oil (petroleum) consumption in India. Why will you say happened to production from past ten years, for example 2007 to 2014?Solution in Telugu
Step by step video & image solution for Collect any graph that shows oil (petroleum) consumption in India. Why will you say happened to production from past ten years, for example 2007 to 2014? by Biology experts to help you in doubts & scoring excellent marks in Class 10 exams.
Topper's Solved these Questions
- BOOK - BEYOND PUBLICATIONCHAPTER - NATURAL RESOURCESEXERCISE - EXERCISE107videos
NATURAL RESOURCES
- BOOK - BEYOND PUBLICATIONCHAPTER - HEREDITY - FROM PARENT TO PROGENYEXERCISE - EXERCISE167videos
HEREDITY - FROM PARENT TO PROGENY
- BOOK - BEYOND PUBLICATIONCHAPTER - NUTRITION FOOD SUPPLYING SYSTEMEXERCISE - EXERCISE184videos
NUTRITION FOOD SUPPLYING SYSTEM
Similar Questions
Read the table and answer the following question.
Is the availability of water resource same for a small and a large farmer ?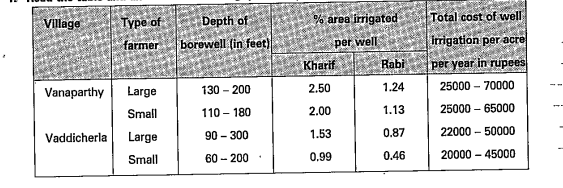 02:54View Solution
What colour of stem would you expect in their F1 progeny ?
View SolutionWhich of the following organisms take the food by parasitic nutrition ?
07:01View SolutionState any five steps to reduce the consumption of coal and petroleum products.
01:05View Solution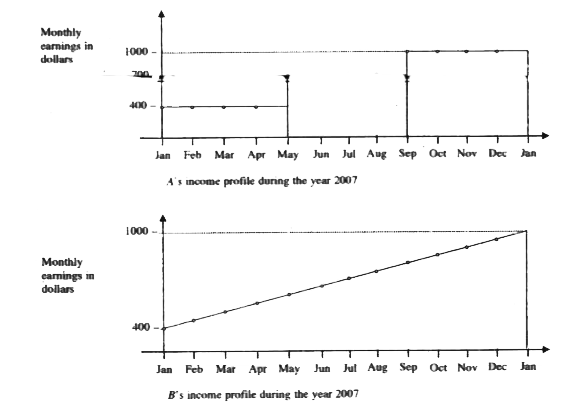
A launched 3 products in the year 2007 and earns income from the sales of the products only. The top graph shows his monthly earning for the year B's earning consist of continuously growing salary growing by same amount each month as shown if the figure. Which one of the following equal the total earning of A and B in the year 2007?04:42View SolutionCollect any graph that shows oil (petroleum) consumption in India.
i) Does the production meet consumption in India ?
ii) During which period of time shows highest increase in consumption rate ?
iii) What will you say happened to production from past ten years, for example 2004 to 2014 ?
iv) Suggest some ways to bring down consumption of petroleum.View SolutionGive two example for products made from petroleum.
01:57View SolutionCollect and examine any graph indicating petroleum consumption in our country
04:27View Solutionஉலக அளவில் கச்சா எண்ணெய் பயன்படுத்தலில் _________ பெரிய நாடு இந்தியாவாகும்.
View SolutionCollect any graph that shows oil (petroleum) con sumption in India
Suggest some ways to bring down consumption of petroleum.03:06View SolutionThe line graph shows the production of product A and B during the period 2004 to 2009 and the second line graph shows the percentage sale of these products
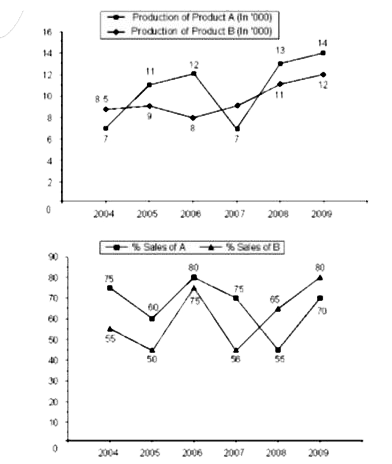
In the given line graph, what is the total sale of products A and B in the year 200701:06View Solutionपहला लाइन ग्राफ उत्पाद A व B के लिए, 2004 से 2009 तक का उत्पादन दिखाता है व दूसरा ग्राफ प्रतिशत बिक्री दिखाता है।
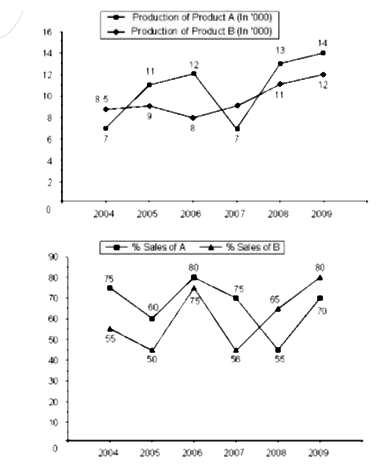
दिए गए ग्राफ में उत्पाद A व B का वर्ष 2007 का बिक्री ज्ञात कीजिये ?01:51View Solutionपहला लाइन ग्राफ उत्पाद A व B के लिए, 2004 से 2009 तक का उत्पादन दिखाता है व दूसरा ग्राफ प्रतिशत बिक्री दिखाता है।
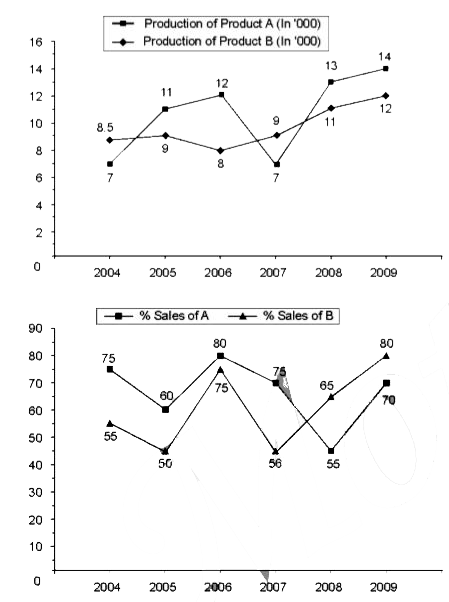
दिए गए ग्राफ में उत्पाद A व B का वर्ष 2007 का बिक्री ज्ञात कीजिये ?View SolutionStudy the graph carefully and answer the questions.
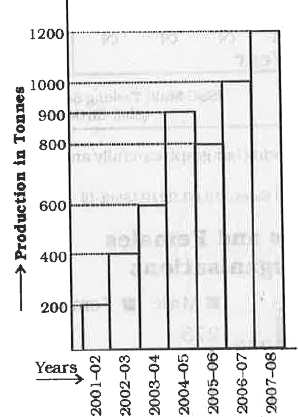
The graph shows production of an item (in tonnes) during certain years
The production from 2003-04 to 2007-08 increased byView SolutionThe following graph shows the production (in thousand) of two types of vehicles (P and Q) by a factory from 2009 to 2014. Study the graph and answer the questions given below: The production of Type Q vehicles in the year 2010 was what percent of the production of Type P in the year 2014?
View Solution
