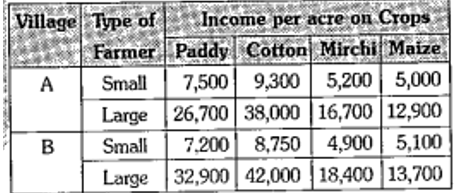
Observe the above table and answer the following questions.
Is there any relationship between production of crops and income ? How ?
 Solution in Telugu
Step by step video & image solution for Observe the above table and answer the following questions.Is there any relationship between production of crops and income ? How ? by Biology experts to help you in doubts & scoring excellent marks in Class 10 exams.
Updated on:21/07/2023Topper's Solved these Questions
- NATURAL RESOURCESBOOK - BEYOND PUBLICATIONCHAPTER - NATURAL RESOURCESEXERCISE - EXERCISE
107 Videos
- HEREDITY - FROM PARENT TO PROGENYBOOK - BEYOND PUBLICATIONCHAPTER - HEREDITY - FROM PARENT TO PROGENYEXERCISE - EXERCISE
167 Videos
- NUTRITION FOOD SUPPLYING SYSTEMBOOK - BEYOND PUBLICATIONCHAPTER - NUTRITION FOOD SUPPLYING SYSTEMEXERCISE - EXERCISE
184 Videos
Similar Questions
Read the table and answer the following question.
Is the availability of water resource same for a small and a large farmer ?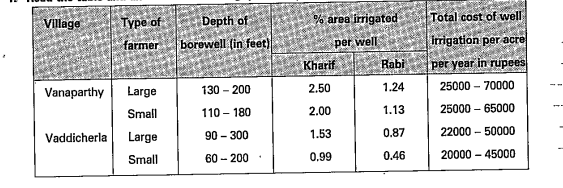
View SolutionWhat colour of stem would you expect in their F1 progeny ?
View SolutionWhich of the following organisms take the food by parasitic nutrition ?
View SolutionDo you think is there any relationship between insects and crop yielding? Why ?
View SolutionGive reasons for the diagonal relationship observed in the periodic table .
View SolutionObserve the table and answer the following question: Which of the above metal's ore are concentrated by using magnetic separation ?

View SolutionGive reasons for the diagonal relationship observed in the periodic table .
View SolutionAnswers any the question :
Describe the strategy involved in the production of Bt crops.
View SolutionObserve the following table showing different activities in the lake and thier influence. Do you find any relationship between bio-logical and physical problems ?
View SolutionRead the table and answer the following questions. Do you find any relationship between biological and physical problems ?
View SolutionThe table given below shows the different crop productions of a state in the years 2008 and 2009. Look at this table and answer the questions that follow. The production of which (which) crop(s) decreased?
View SolutionStudy the table graph carefully to answer the questions that follows
Production of main crops in India (in million tonnes)
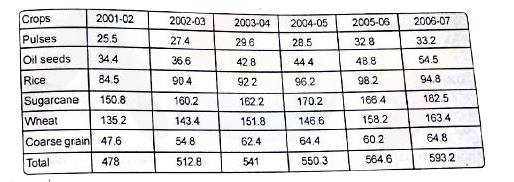
Production of rice was what percentage of the total crops produced in the year 2001-02 ?
View SolutionStudy the table graph carefully to answer the questions that follows
Production of main crops in India (in million tonnes)
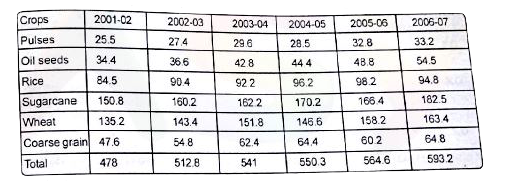
What was the average production of rice in the given years?
View SolutionStudy the table graph carefully to answer the questions that follows
Production of main crops in India (in million tonnes)
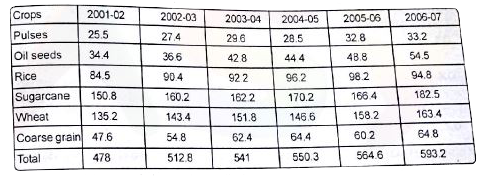
What is the difference of average production of Pulses and Sugarcane ?
View Solutionआय और उपभोग में किस प्रकार का संबंध है?
View Solution
