Fill in the blanks : If the plot of log (a−x)vs t is a straightline the order of the reaction is ………..Solution in Odia
Step by step video & image solution for Fill in the blanks : If the plot of log (a - x) vs t is a straightline the order of the reaction is ……….. by Chemistry experts to help you in doubts & scoring excellent marks in Class 12 exams.
Updated on:21/07/2023Topper's Solved these Questions
Similar Questions
The correct order of acidic strength is
View SolutionA group of atoms can function as a ligand only when?
View SolutionDraw the plot log V vs log T.
View SolutionFor a first order reaction, the reaction, the plot of logC against 't' (log C vs 't') gives a straight line with slope equal to:
View SolutionAssertion: A plot of log-log(dX)/(d t) vs. log(a-X) leads to value of K as antilog (inercept) and slope equal to order of reaction. Reason: (dX)/(d t) = K(a-X)^(n) .
View SolutionWhich among the following plots are linear (a -x) is the concentration of reactant remaining after time , t (a) (a - x) vs t , for a first order reaction (b) (a - x) vs t , for a zero order reaction (c) (a - x) vs t , for a second order reaction (d) 1/(a - x) vs t , for a second order reaction
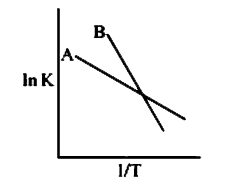
View SolutionPlot ln K vs. 1/T for two reactions A and B are given below. Which reaction is more sensitive to temperature :-

View SolutionFor a first order reaction, the plot of log[A]_(t)vs t is linear with a
View SolutionPlot of log (a- x) vs time t is straight line. This indicates that the reaction is of:
View SolutionPlot of log (a- x) vs time t is straight line. This indicates that the reaction is of:
View SolutionFor a 1st order reaction log(a−x) is plotted Vs time, a straight line is obtained with slope
View SolutionDraw the plot of log V vs log T.
View SolutionFor a chemical reaction variation in concentraction, ln[R] vs. time (min) plot is shown below : What is the order of the reaction?
View SolutionFor a chemical reaction variation in concentraction, ln[R] vs. time (min) plot is shown below :

Draw the plot of log[R]∘R vs. time(s).
View SolutionDraw the plot log V vs log T.
View Solution
