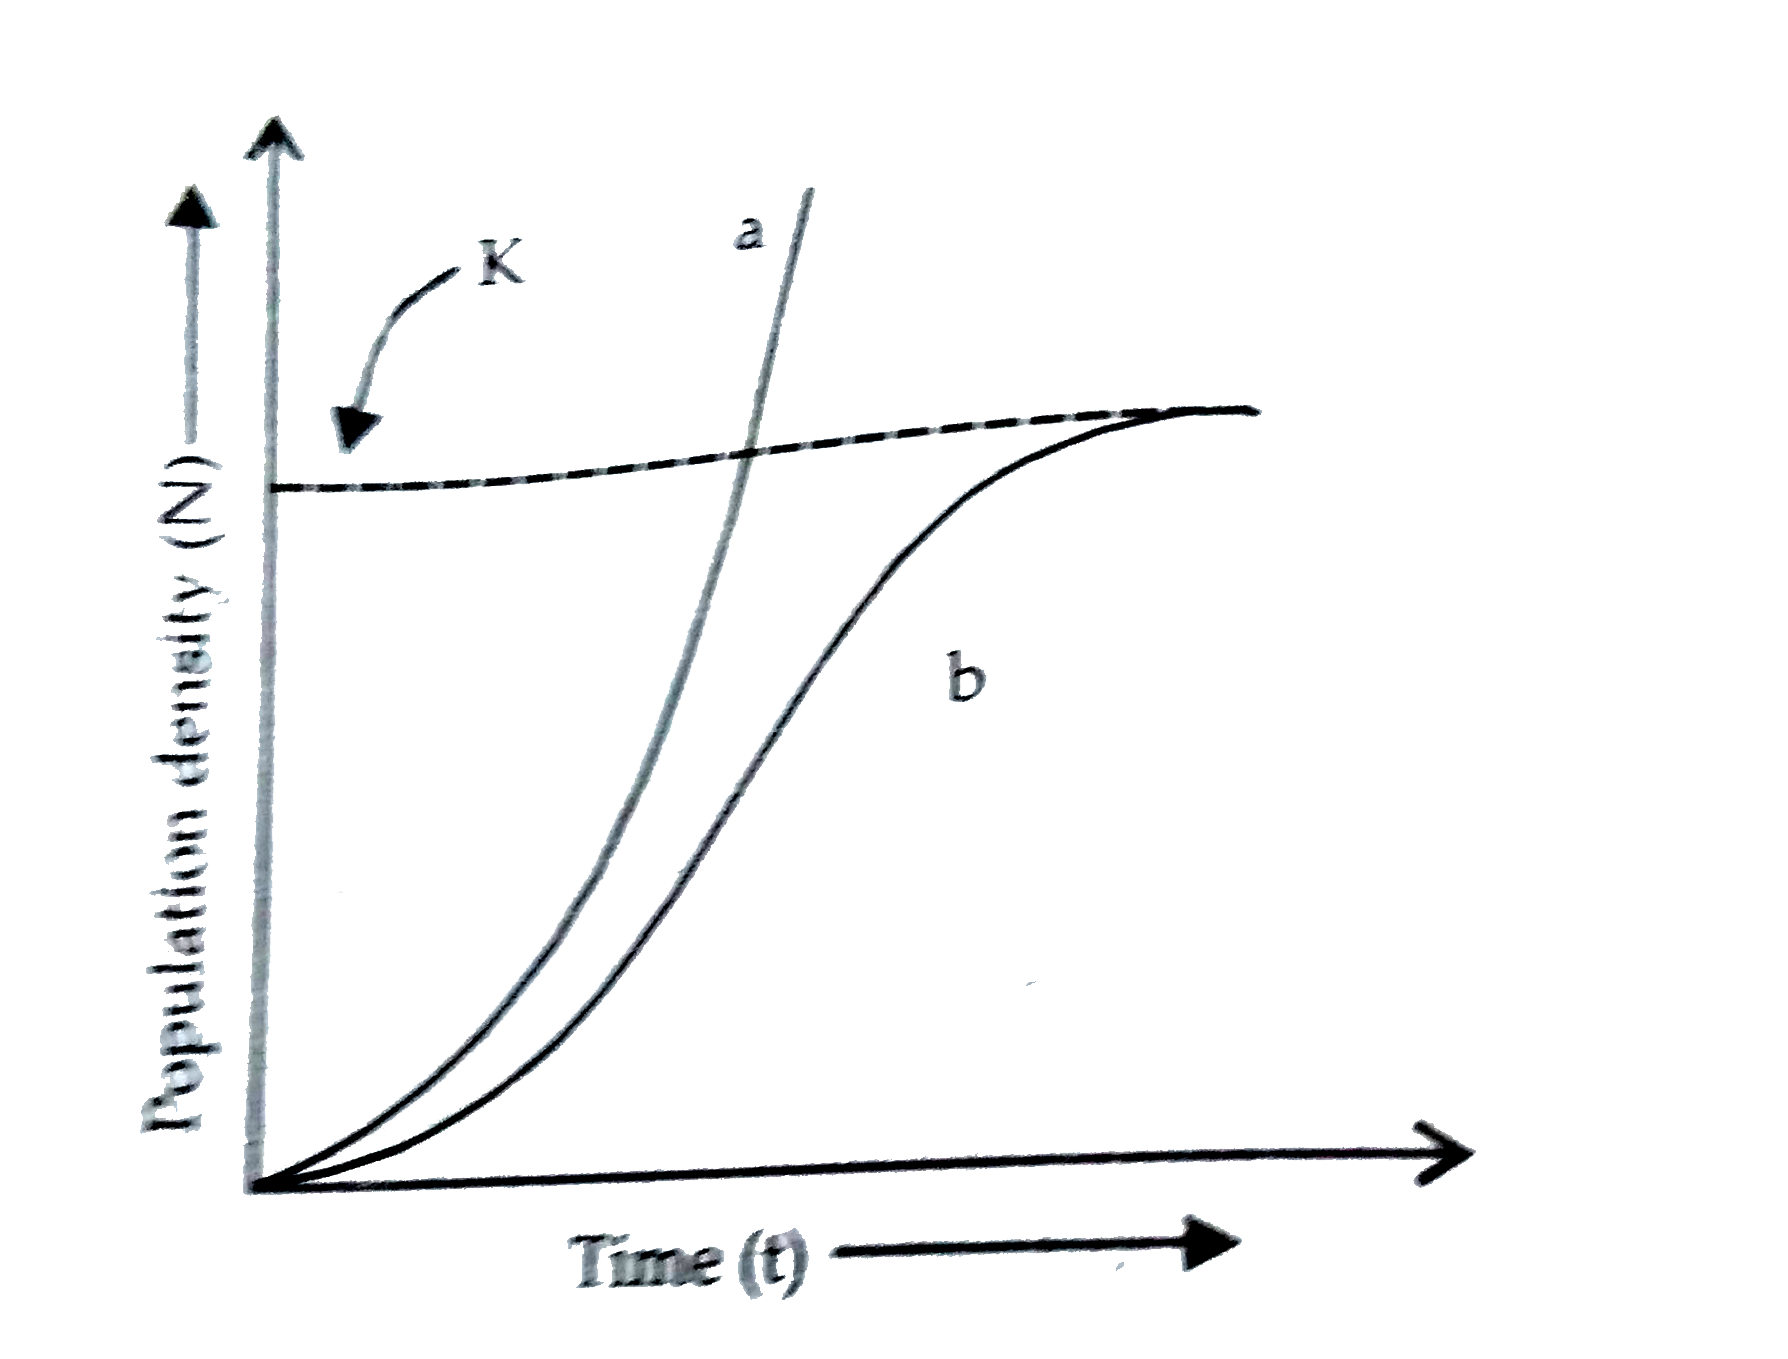
Most realistic growth curve is
J-shaped
Sigmoid
Parabolic
Both (a) & (b)
The correct Answer is:B
To determine the most realistic growth curve among the options provided, we can analyze each curve based on its characteristics and implications for population growth over time.
1. Identify the Growth Curves:
- The question mentions four types of growth curves: J-shaped curve, sigmoid curve, parabolic curve, and one unspecified curve.
2. Analyze the J-shaped Curve:
- The J-shaped curve represents exponential growth without any limits. It suggests that a population grows indefinitely, which is unrealistic in natural conditions because resources are finite.
3. Examine the Sigmoid Curve:
- The sigmoid curve (S-shaped curve) includes three distinct phases:
- Lag Phase: Initial slow growth as the population adjusts to the environment.
- Log Phase: Rapid growth as resources are plentiful.
- Stationary Phase: Growth stabilizes as resources become limited and the population reaches carrying capacity.
- This curve reflects natural population dynamics and is considered realistic.
4. Consider the Parabolic Curve:
- The parabolic curve suggests a growth pattern that is not typically observed in natural populations. It implies that growth will increase to a point and then decline, which does not accurately represent how populations behave in the wild.
5. Conclusion:
- Based on the analysis, the sigmoid curve is the most realistic growth curve because it accounts for the different phases of growth and the limitations imposed by environmental factors.
Final Answer:
The most realistic growth curve is the sigmoid curve.
- The question mentions four types of growth curves: J-shaped curve, sigmoid curve, parabolic curve, and one unspecified curve.
- The J-shaped curve represents exponential growth without any limits. It suggests that a population grows indefinitely, which is unrealistic in natural conditions because resources are finite.
- The sigmoid curve (S-shaped curve) includes three distinct phases:
- Lag Phase: Initial slow growth as the population adjusts to the environment.
- Log Phase: Rapid growth as resources are plentiful.
- Stationary Phase: Growth stabilizes as resources become limited and the population reaches carrying capacity.
- This curve reflects natural population dynamics and is considered realistic.
- The parabolic curve suggests a growth pattern that is not typically observed in natural populations. It implies that growth will increase to a point and then decline, which does not accurately represent how populations behave in the wild.
- Based on the analysis, the sigmoid curve is the most realistic growth curve because it accounts for the different phases of growth and the limitations imposed by environmental factors.
The most realistic growth curve is the sigmoid curve.
Topper's Solved these Questions
- PLANT GROWTH AND DEVELOPMENTBook:PHYSICS WALLAHChapter:PLANT GROWTH AND DEVELOPMENTExercise:LEVEL-2
Explore 29 Videos
- PLANT GROWTH AND DEVELOPMENTBook:PHYSICS WALLAHChapter:PLANT GROWTH AND DEVELOPMENTExercise:NEET PAST 10 YEARS QUESTIONS
Explore 17 Videos
- PHOTOSYNTHESIS IN HIGHER PLANTS Book:PHYSICS WALLAHChapter:PHOTOSYNTHESIS IN HIGHER PLANTS Exercise:NEET PAST 10 YEARS QUESTIONS
Explore 23 Videos
- PLANT KINGDOMBook:PHYSICS WALLAHChapter:PLANT KINGDOMExercise:NEET PAST 10 YEARS QUESTIONS
Explore 36 Videos
Similar Questions
What is growth curve ?
View SolutionStudy the population growth curves in the graph given below and answer the questions which follow :
(i) Identify the growth curves ‘a’ and ‘b’.

(ii) Which one. of them is considered a more realistic one and why ?
If dN9dt)=rN(K−NK) is the equation of the logistic growth curve, what does K stand for ?
(iv) What is symbolised by N ?
View Solution
Knowledge Check
Asymptote in a logistic growth curve is obtained, when
AThe value of 'r' approaches zeroBK=NCK>NDK<NAsymptote in a logistic growth curve is obtained when
AK=NBK>NCK<NDThe value of 'r' approaches zeroAsymptote in a logistic growth curve is obtained when
AThe value of 'r' approaches zeroBK = NCK>NDK<N
(a) Name the two growth models that represent population growth and draw the respective growth curves they represent.
(b) State the basis for the difference in the shape of these curves.
(c) Which one of the curves represent the human population growth at present? Do you think such a curve is sustainable ? Give reason in support of your answer.
View SolutionAsymptote in a logistic growth curve is obtained when
View SolutionSigmoid/logistic growth curve is represented by
View SolutionGrowth curve indicates
View SolutionThe rate of growth of any organism follows
Or
Typical growth curve in plants is
View Solution
