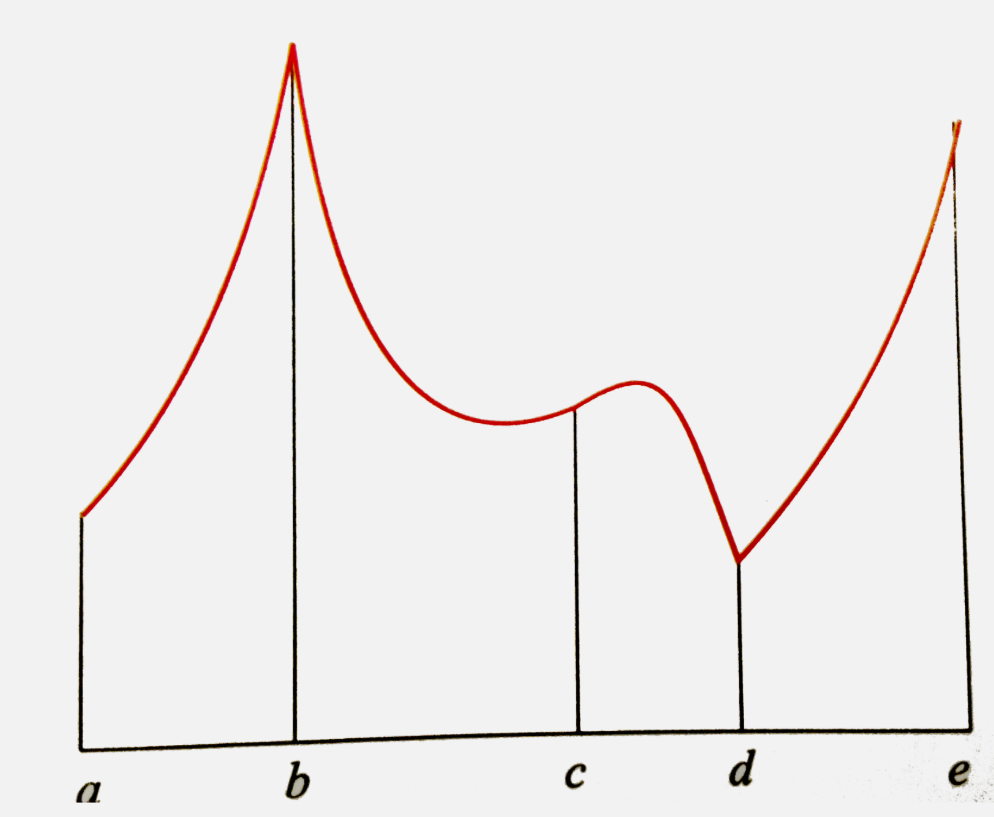
The graph of a function is shown in the following figure.

Determine the intervals on which the function is concave up and the intervals on which it is concave down. Find the x - coordinates of any inflection points.Solution in Tamil
The graph is concave up on a<x<b,b<x<candd<x<e. The graph is concave down on c<x<d.
Note that concavity is a property of a graph on an open interval, so the endpoints are not included.
There are inflection points at x = c and x = d.
Topper's Solved these Questions
- BOOK - CENGAGECHAPTER - GETTING STARTED WITH GRAPHSEXERCISE - Exercise18videos
GETTING STARTED WITH GRAPHS
- BOOK - CENGAGECHAPTER - FUNCTIONSEXERCISE - Question Bank21videos
FUNCTIONS
- BOOK - CENGAGECHAPTER - GRAPH OF INVERSE TRIGONOMETRIC FUNCTIONSEXERCISE - Exercise18videos
GRAPH OF INVERSE TRIGONOMETRIC FUNCTIONS
Similar Questions
Does the following graph pass the vertical or horizontal line test ?
 View Solution
If there are four distinct real numbers satisfying thẻ equation ∣∣x2−4x−7∣∣=n, then number of integers in the range of n is
06:07View SolutionDraw the graph of y=tan−1x+cot−1x
02:11View SolutionThe graph of a function is shown in the following figure.

Determine the intervals on which the function is concave up and the intervals on which it is concave down. Find the x - coordinates of any inflection points.01:31View SolutionWhich of the following are correct chain isomers of butane ? (i)
02:45View SolutionDetermine the point of symmetry of a regular hexagon.
02:17View SolutionDtermine the images of the following figure about the given line :
05:41View SolutionMatch the following Column A to Column B
 02:10View Solution
Match the following Column A to Column B
 02:17View Solution
Match the following Column A to Column B
 02:10View Solution
The inequation represented by the graph given below is :
04:23View SolutionThe inequation that best describes the graph given below is _________
01:59View SolutionThe inequation that best describes the following graph is _________
01:19View SolutionWhich inequations represent the shaded region in the given figure
02:48View SolutionThe equation of straight line shown in figure is :
ltimg src="https://d10lpgp6xz60nq.cloudfront.net/physics_images/ALN_PHY_R04_E01_020_Q01.png" width="80%"gt01:45View Solution

