Draw the graph of |y|=(x−1)(x−2)(x−3).Solution in Tamil
To draw the graph of y=f(x)=(x−1)|(x−2)(x−3)|, we first draw the graph of
y=g(x)=(x−1)(x−2)(x−3)
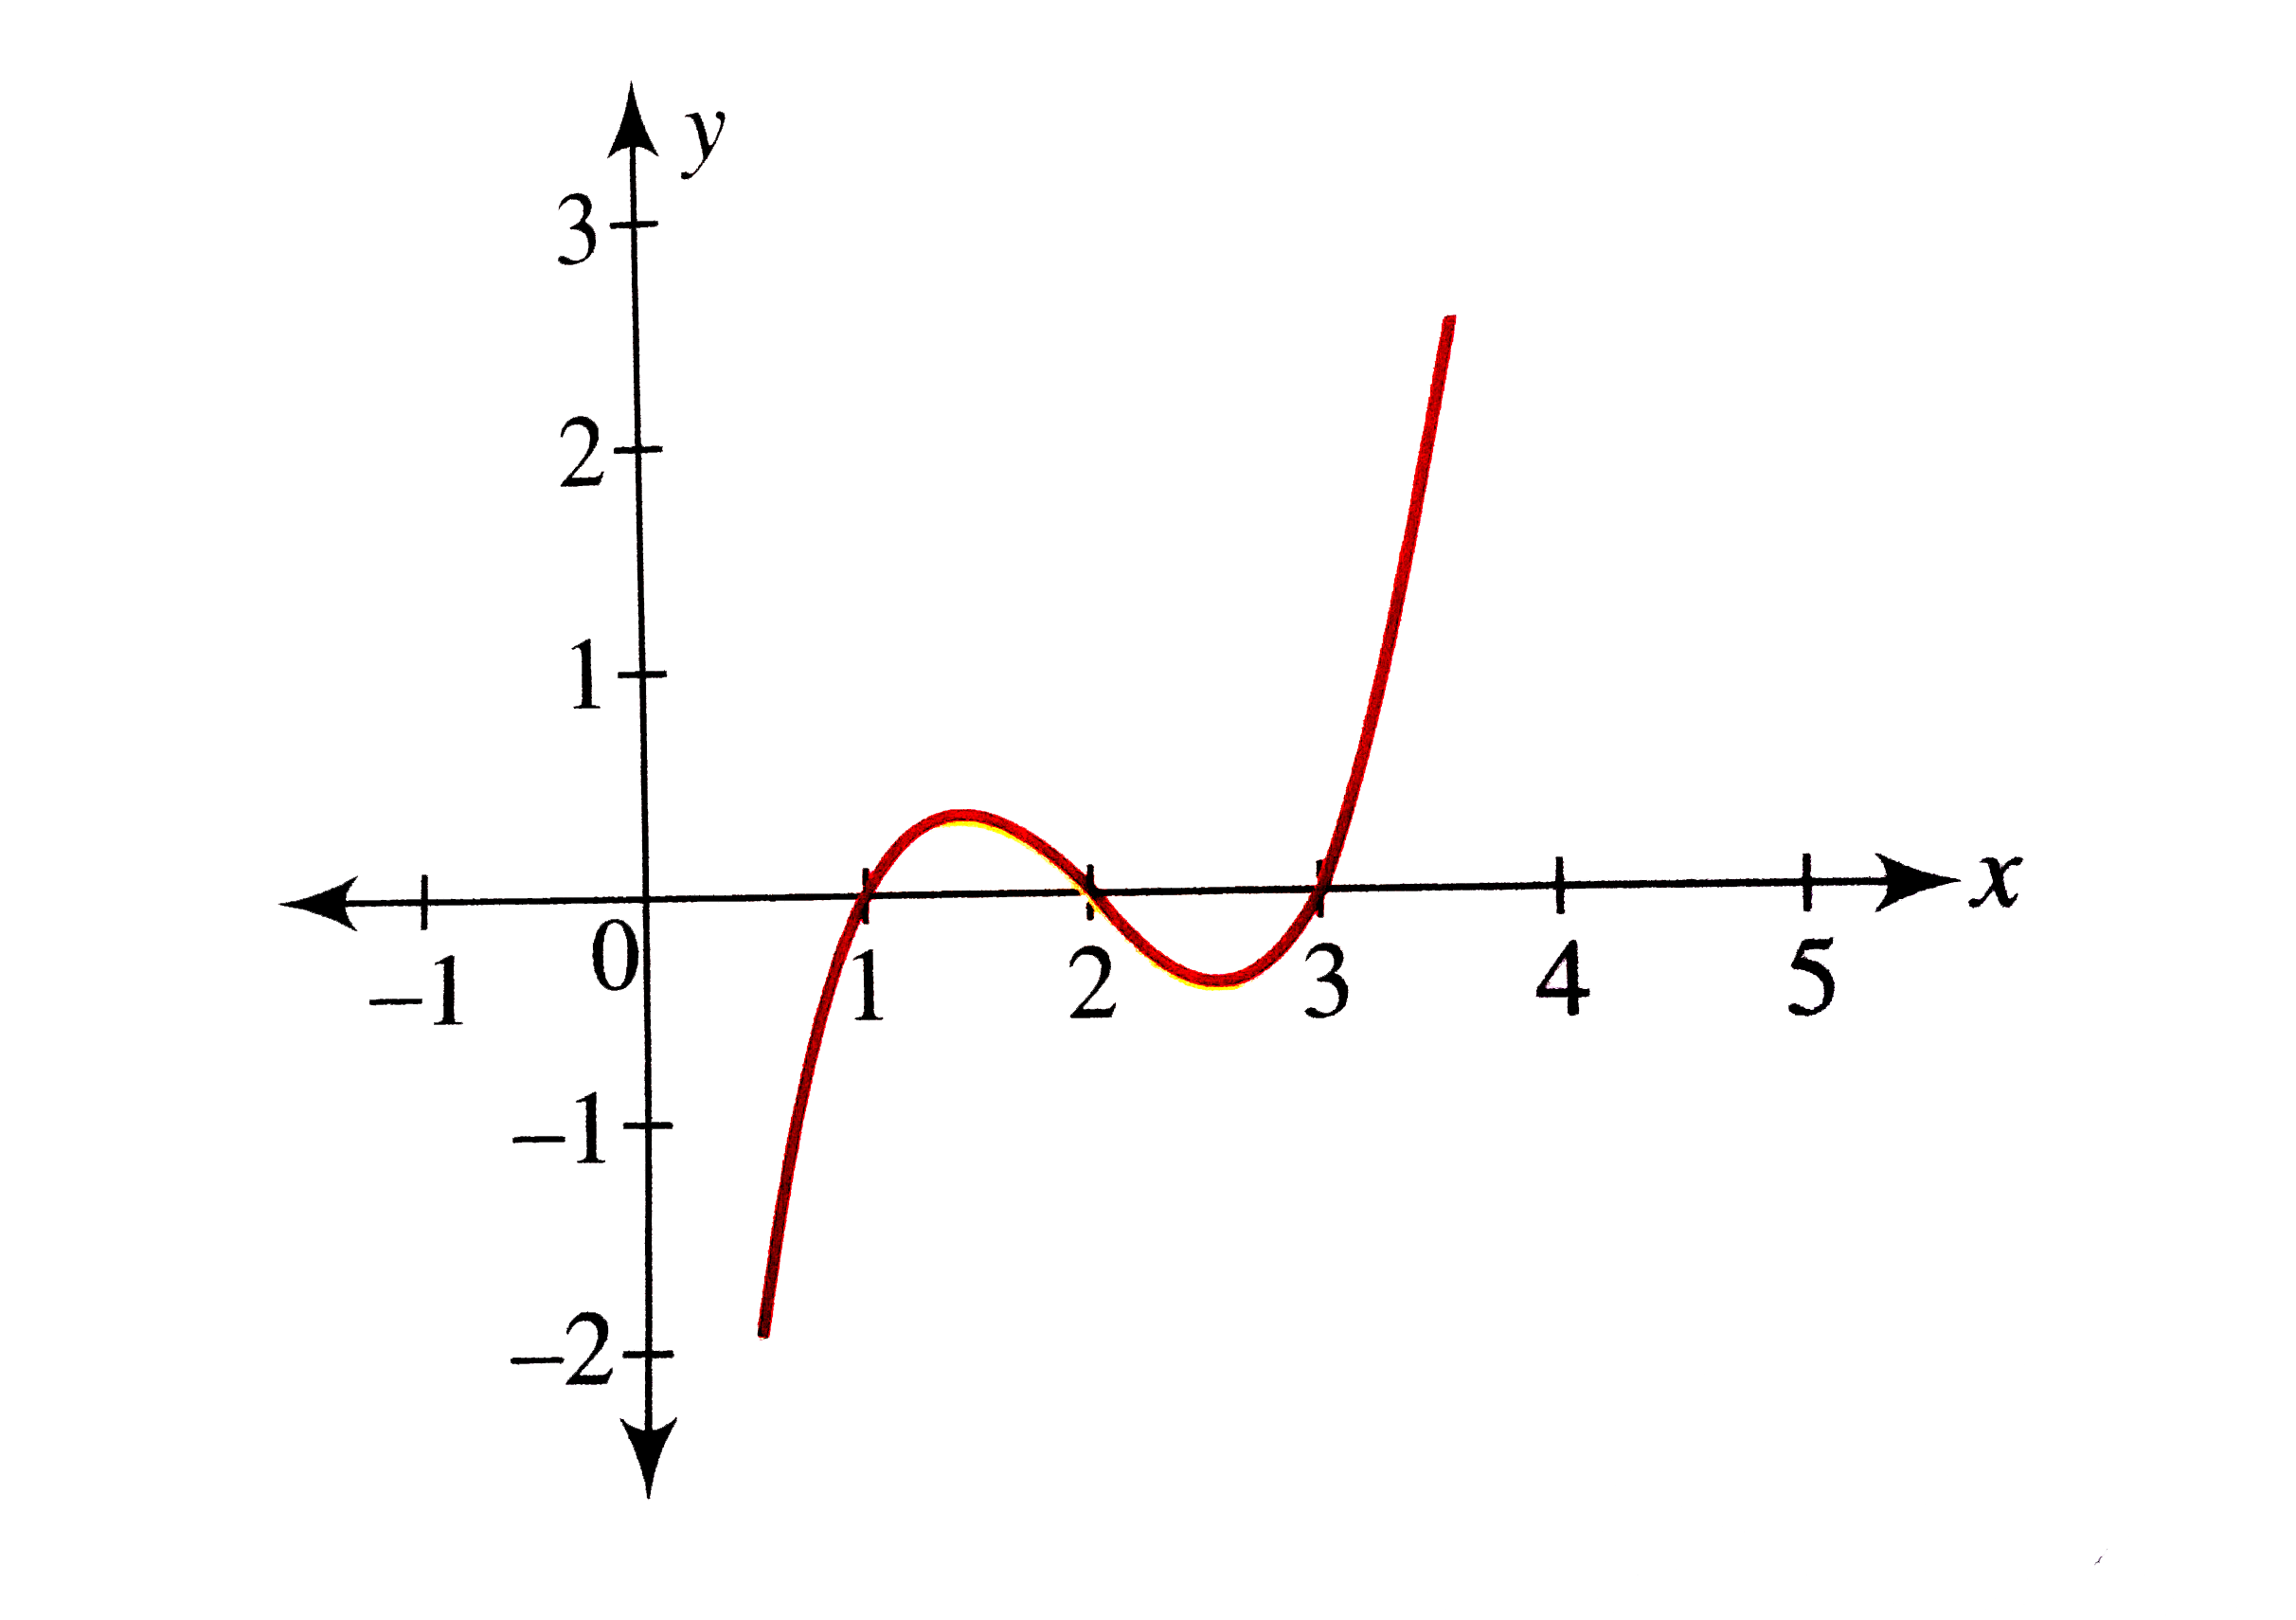
The graph of y=g(x) can be drawn using the sign scheme of g(x).

Using the sign scheme, we draw the graph of y=g(x) as a wave as shown in the following figure.

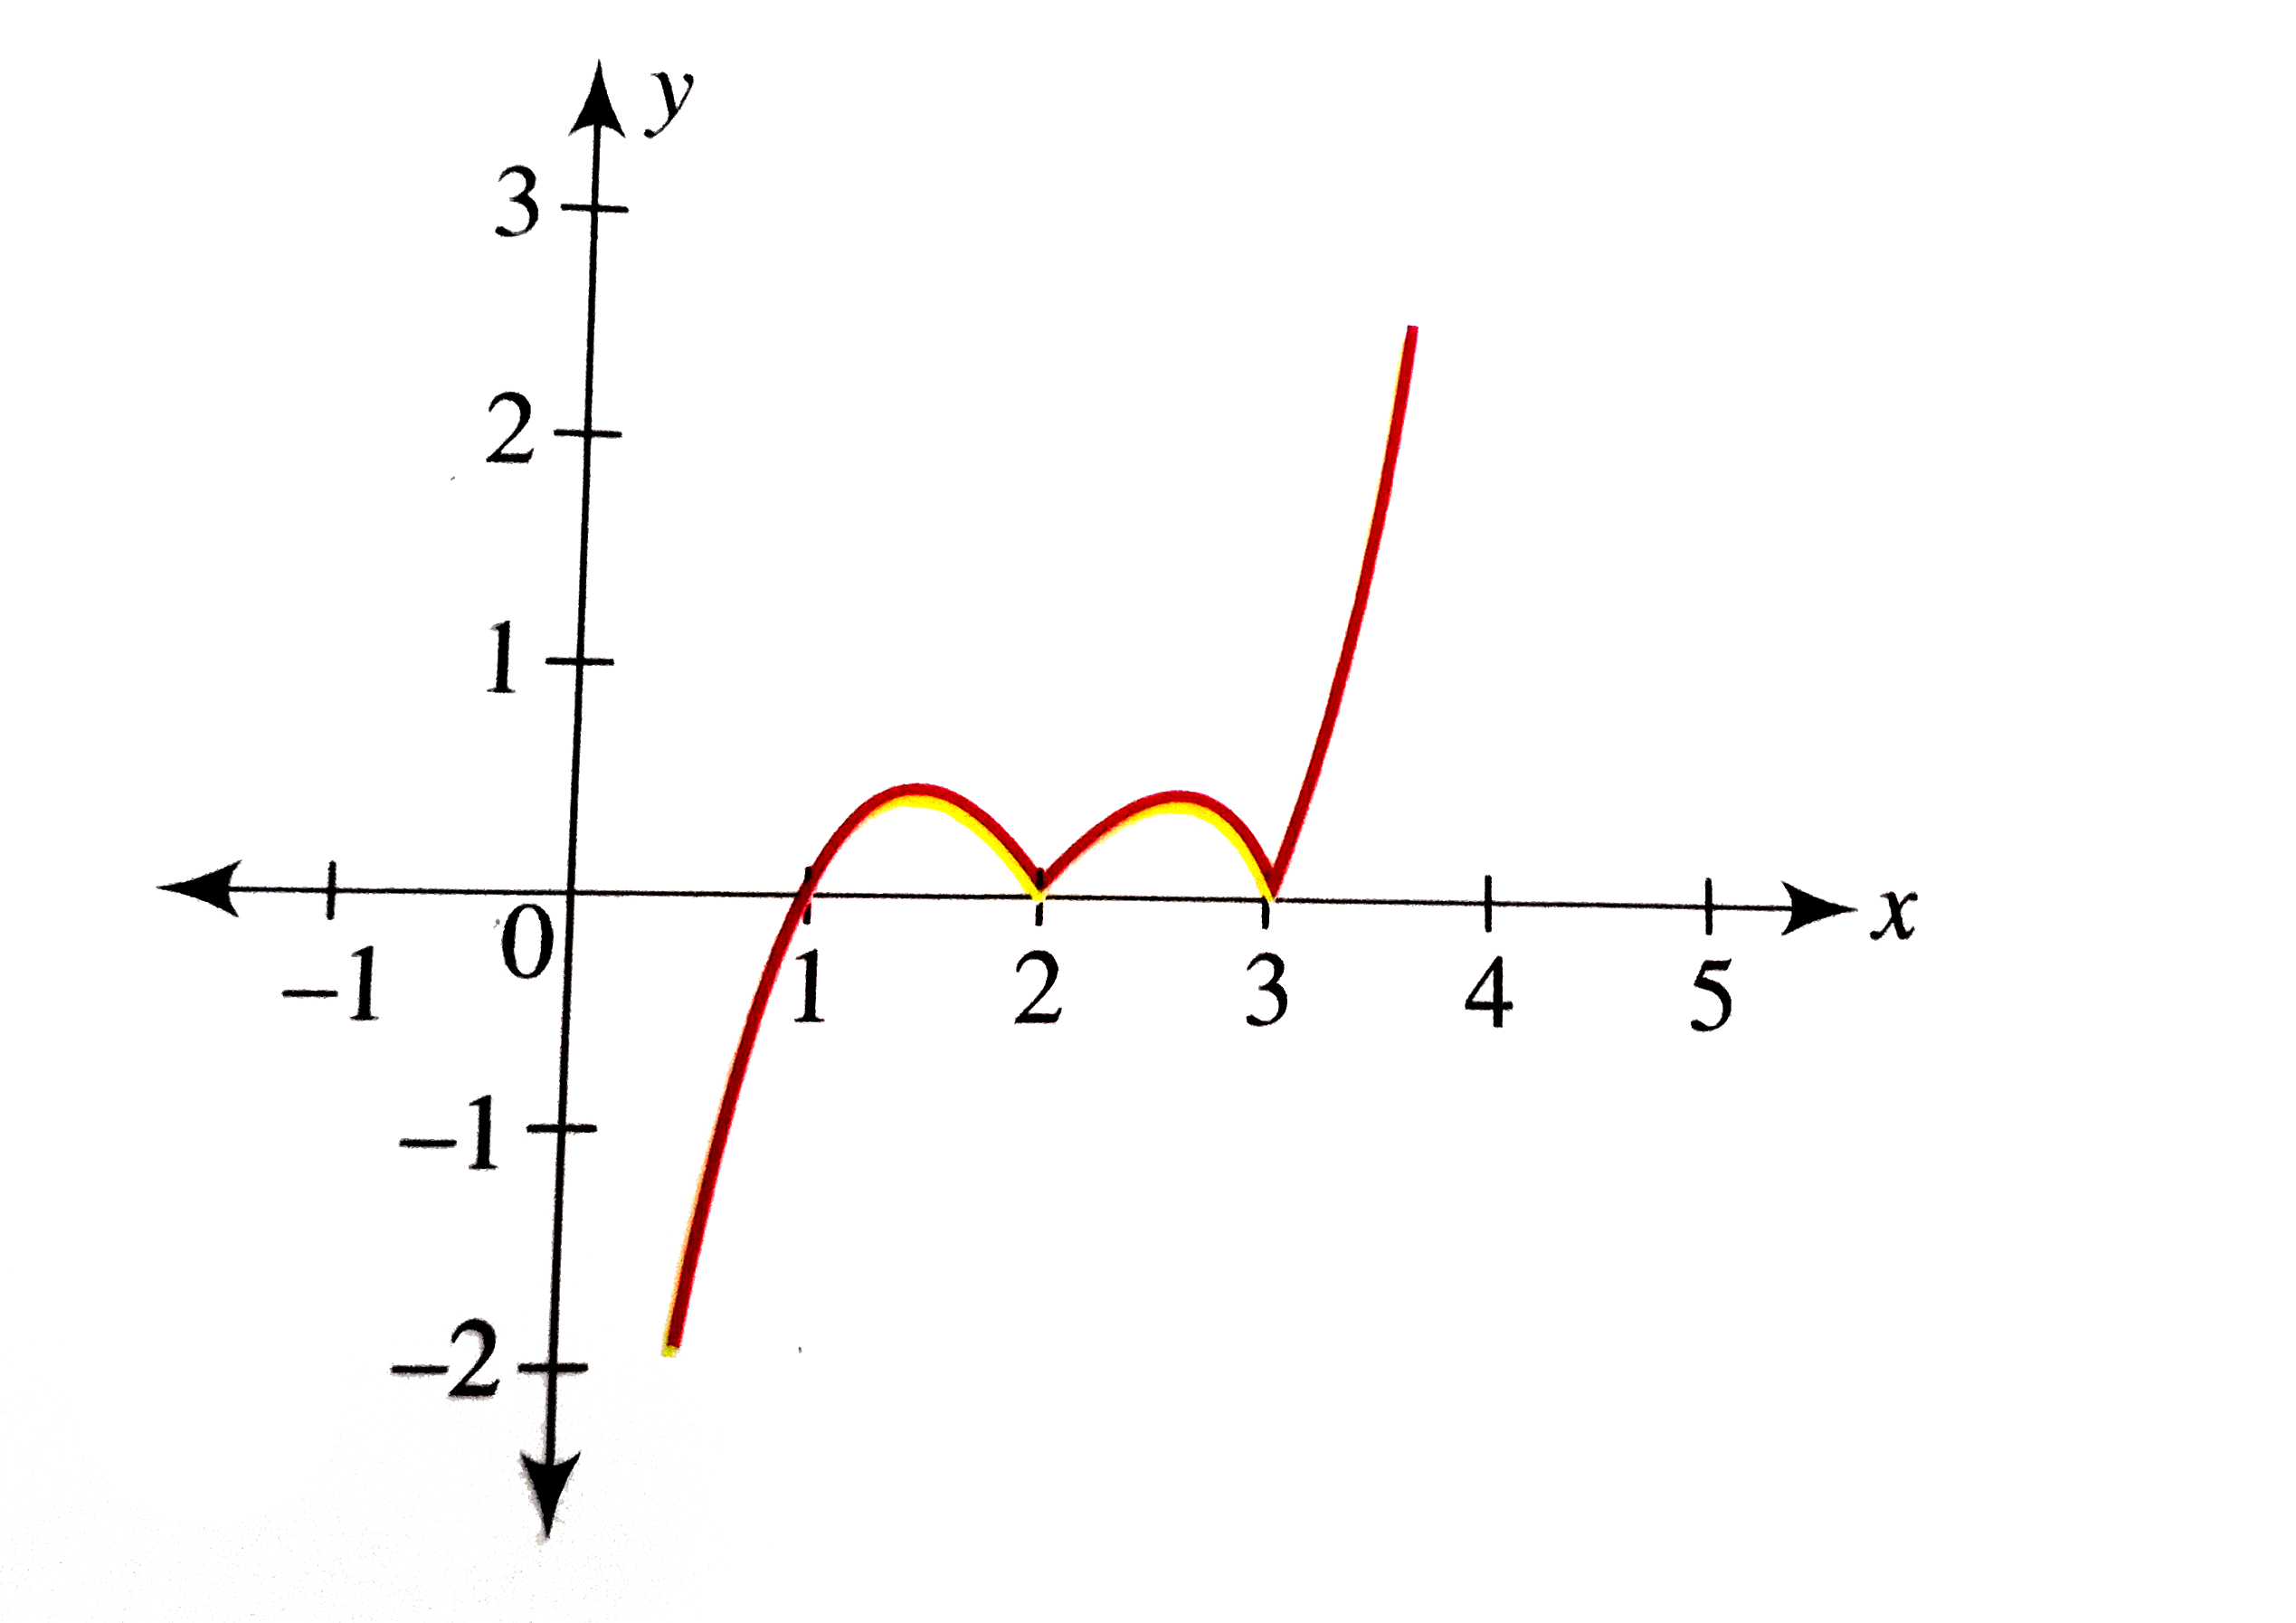
Now the sign scheme of f(x) is as follows.

According to the above sign scheme, to draw the graph of y=f(x), we reflect the graph of y=g(x) above the x-axis for x∈(2,3). So the graph of y=f(x) is as shown in the following figure.

For g(x)=(x−1)(x−2)(x−3)
=x3−6x2+11x−6
g'(x)=3x2−12x+11
g'(x)=0∴x=12±√144−1326=12±√126=2±1√3
Thus, x=2−1√3 and x=2+1√3, points of local maxima and local minima, respectively, for y=g(x).
For y=f(x),x=2±1√3 are the points of local maxima.
Topper's Solved these Questions
- BOOK - CENGAGECHAPTER - GRAPHS OF POLYNOMIAL AND RATIONAL FUNCTIONSEXERCISE - Exercise13videos
GRAPHS OF POLYNOMIAL AND RATIONAL FUNCTIONS
- BOOK - CENGAGECHAPTER - GRAPHS OF POLYNOMIAL AND RATIONAL FUNCTIONSEXERCISE - Exercises4videos
GRAPHS OF POLYNOMIAL AND RATIONAL FUNCTIONS
- BOOK - CENGAGECHAPTER - GRAPHICAL TRANSFORMATIONSEXERCISE - Exercise14videos
GRAPHICAL TRANSFORMATIONS
- BOOK - CENGAGECHAPTER - GRAPHS OF ELEMENTARY FUNCTIONS EXERCISE - Exercise34videos
GRAPHS OF ELEMENTARY FUNCTIONS
Similar Questions
Draw the graph of y=(x−1)(x2−x+1).
04:34View SolutionSketch the graph of an example of a rational function f that satisfies all the given conditions.
(i) f(0)=0,f(1),limx→∞f(x)=0,f is odd
(ii) limx→0+f(x)=∞,limx→0−f(x)=−∞,limx→∞f(x)=1,limx→−∞f(x)=1
(iii) limx→−2f(x)=∞,limx→−∞f(x)=3,limx→∞f(x)=3,f(0)=002:16View SolutionDraw the graph of y=tan−1x−cot−1x.
01:18View SolutionDraw the graph of y=1(1/x).
View SolutionDraw the graph of |y|=(x−1)(x−2)(x−3).
01:32View SolutionDraw graph of y=1x2−x.
02:03View SolutionDraw the graph of y=x−1x−2.
03:14View SolutionDraw the graph of y=|||x|−2|−3| by transforming the graph of y=|x|
03:03View SolutionDraw the graph for |y|=(x−1)(x−2).
09:21View SolutionDraw the graph of |y|=(x−1)(x−2)(x−3).
02:29View SolutionDraw graph of y=1x2−x.
05:13View SolutionDraw the graph of y=x−1x−2.
02:04View SolutionDraw the graph of y=|||x|−2|−3| by transforming the graph of y=|x|
02:24View SolutionDraw the graph for |y|=(x−1)(x−2).
03:59View SolutionDraw the graphs of y=|x+2|−|x−3|
01:39View Solution

