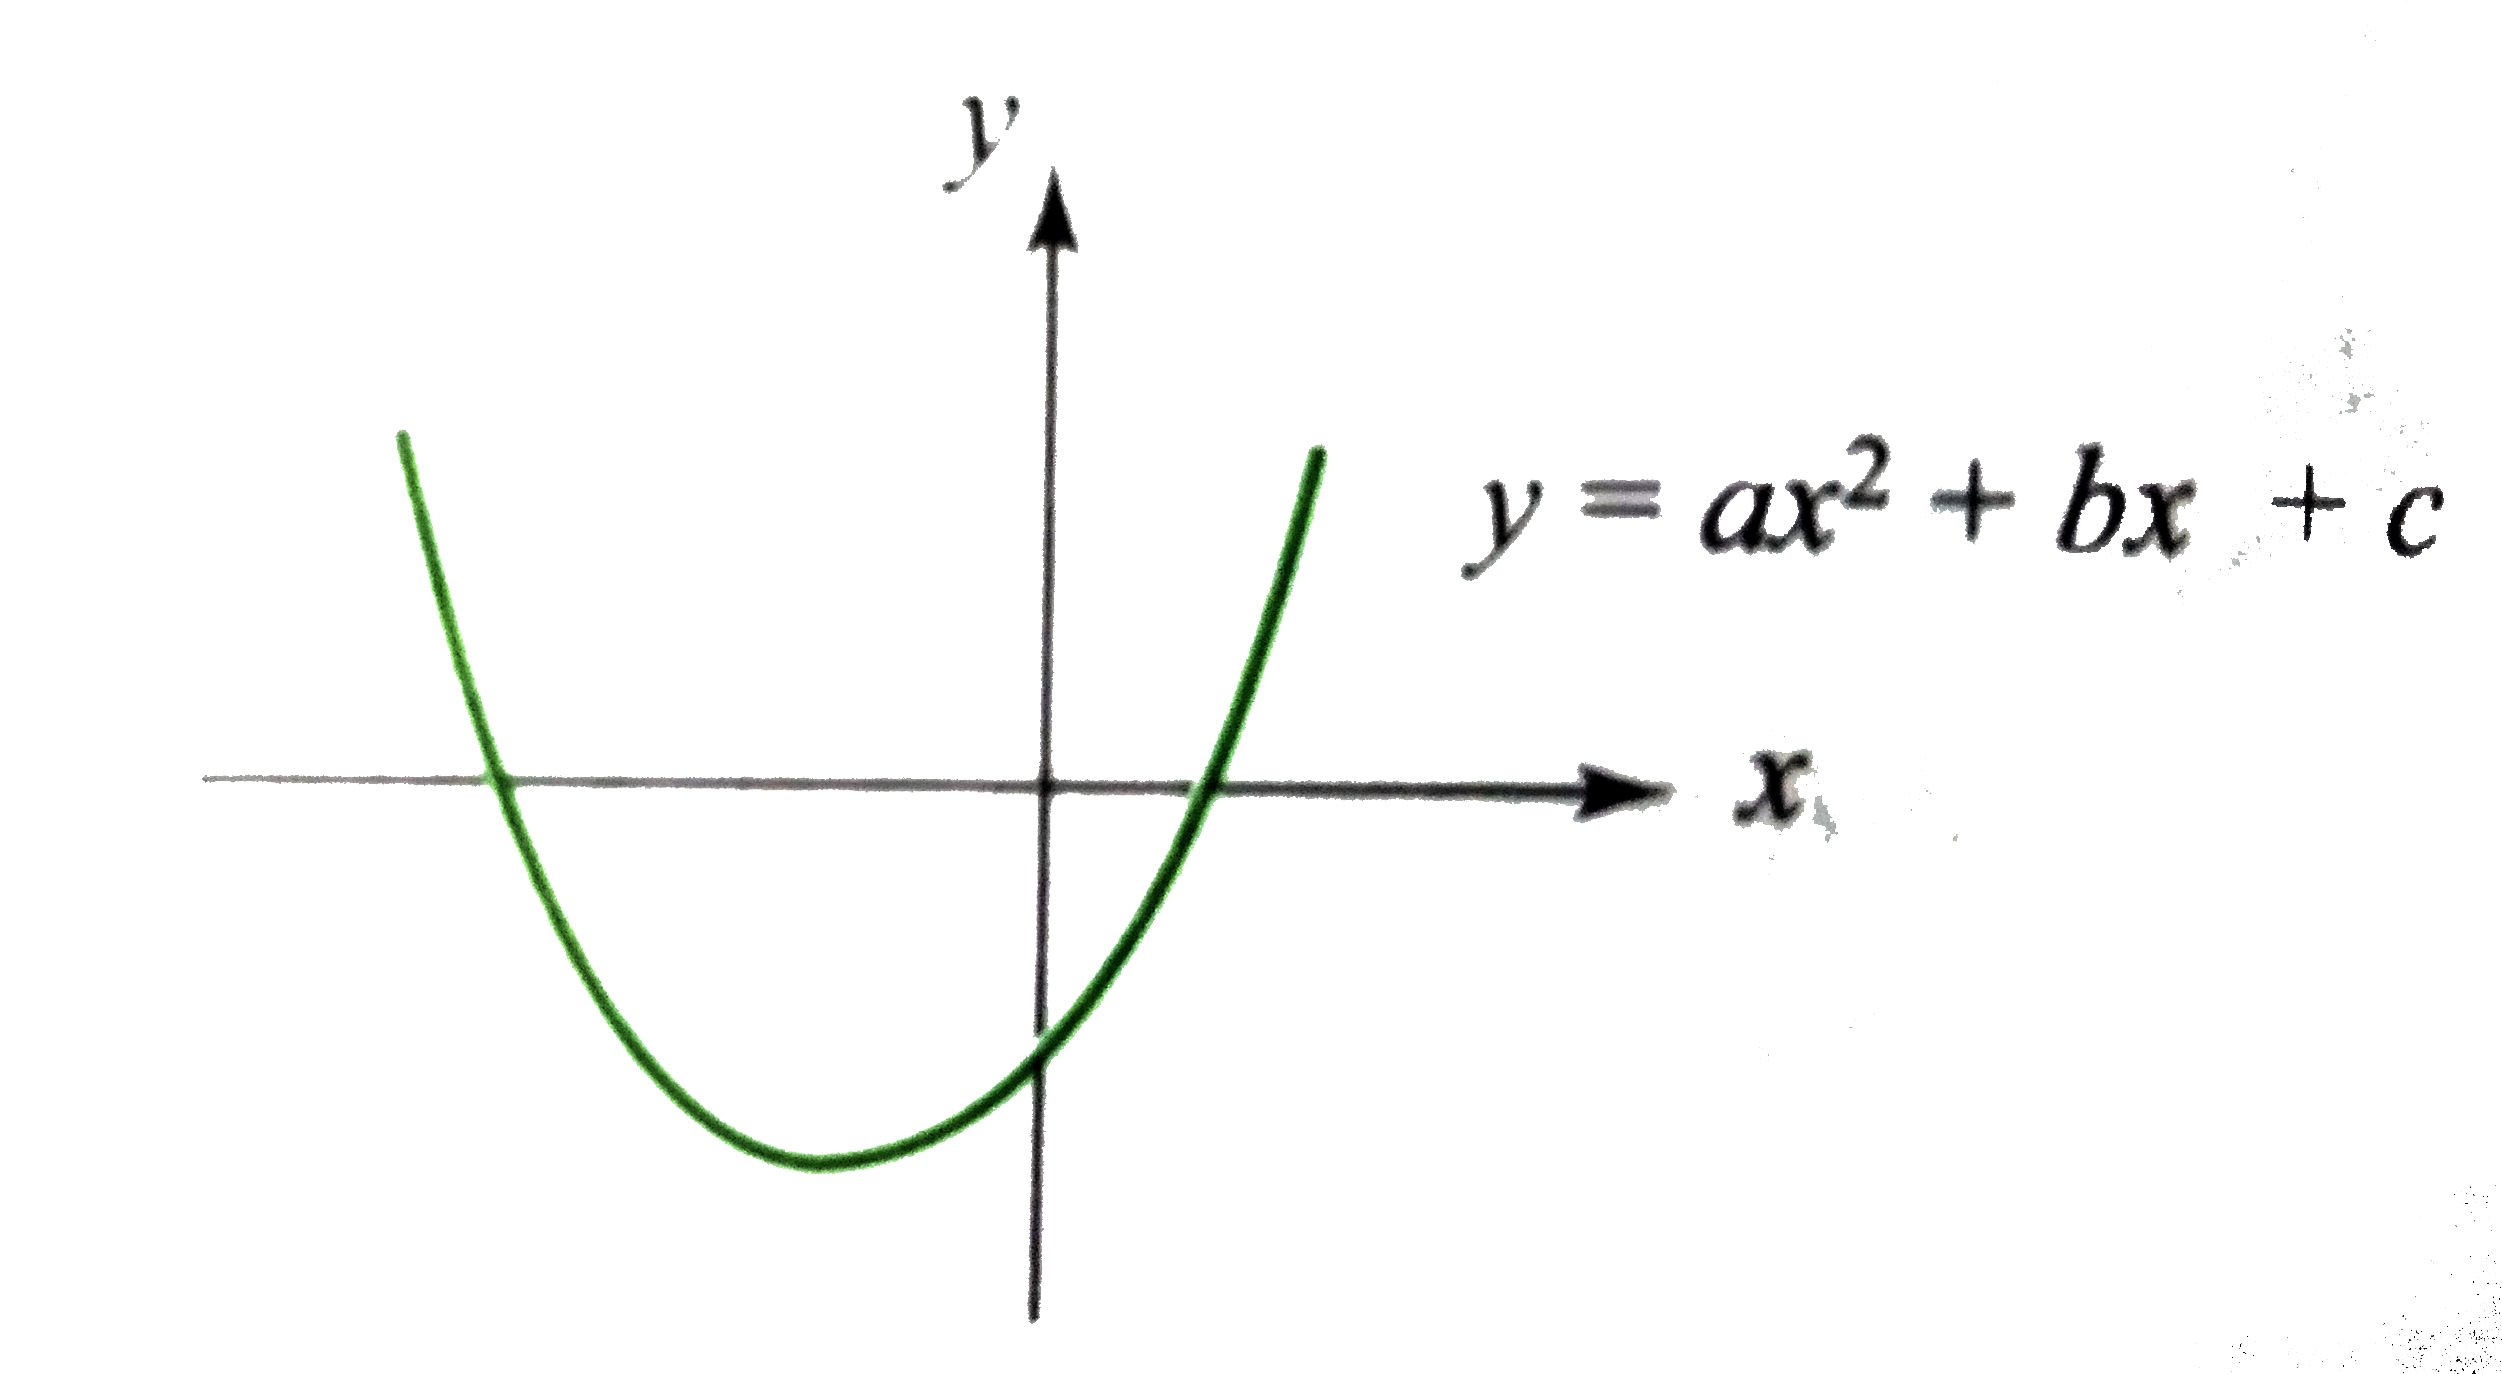
Let f(X)=ax2+bx+c. Consider the following diagram
 . Solution in Tamil
c<0
b>0
a+b−c>0
abc<0
The correct Answer is:1,2,3,4
Let f(x)=ax2+bx+c

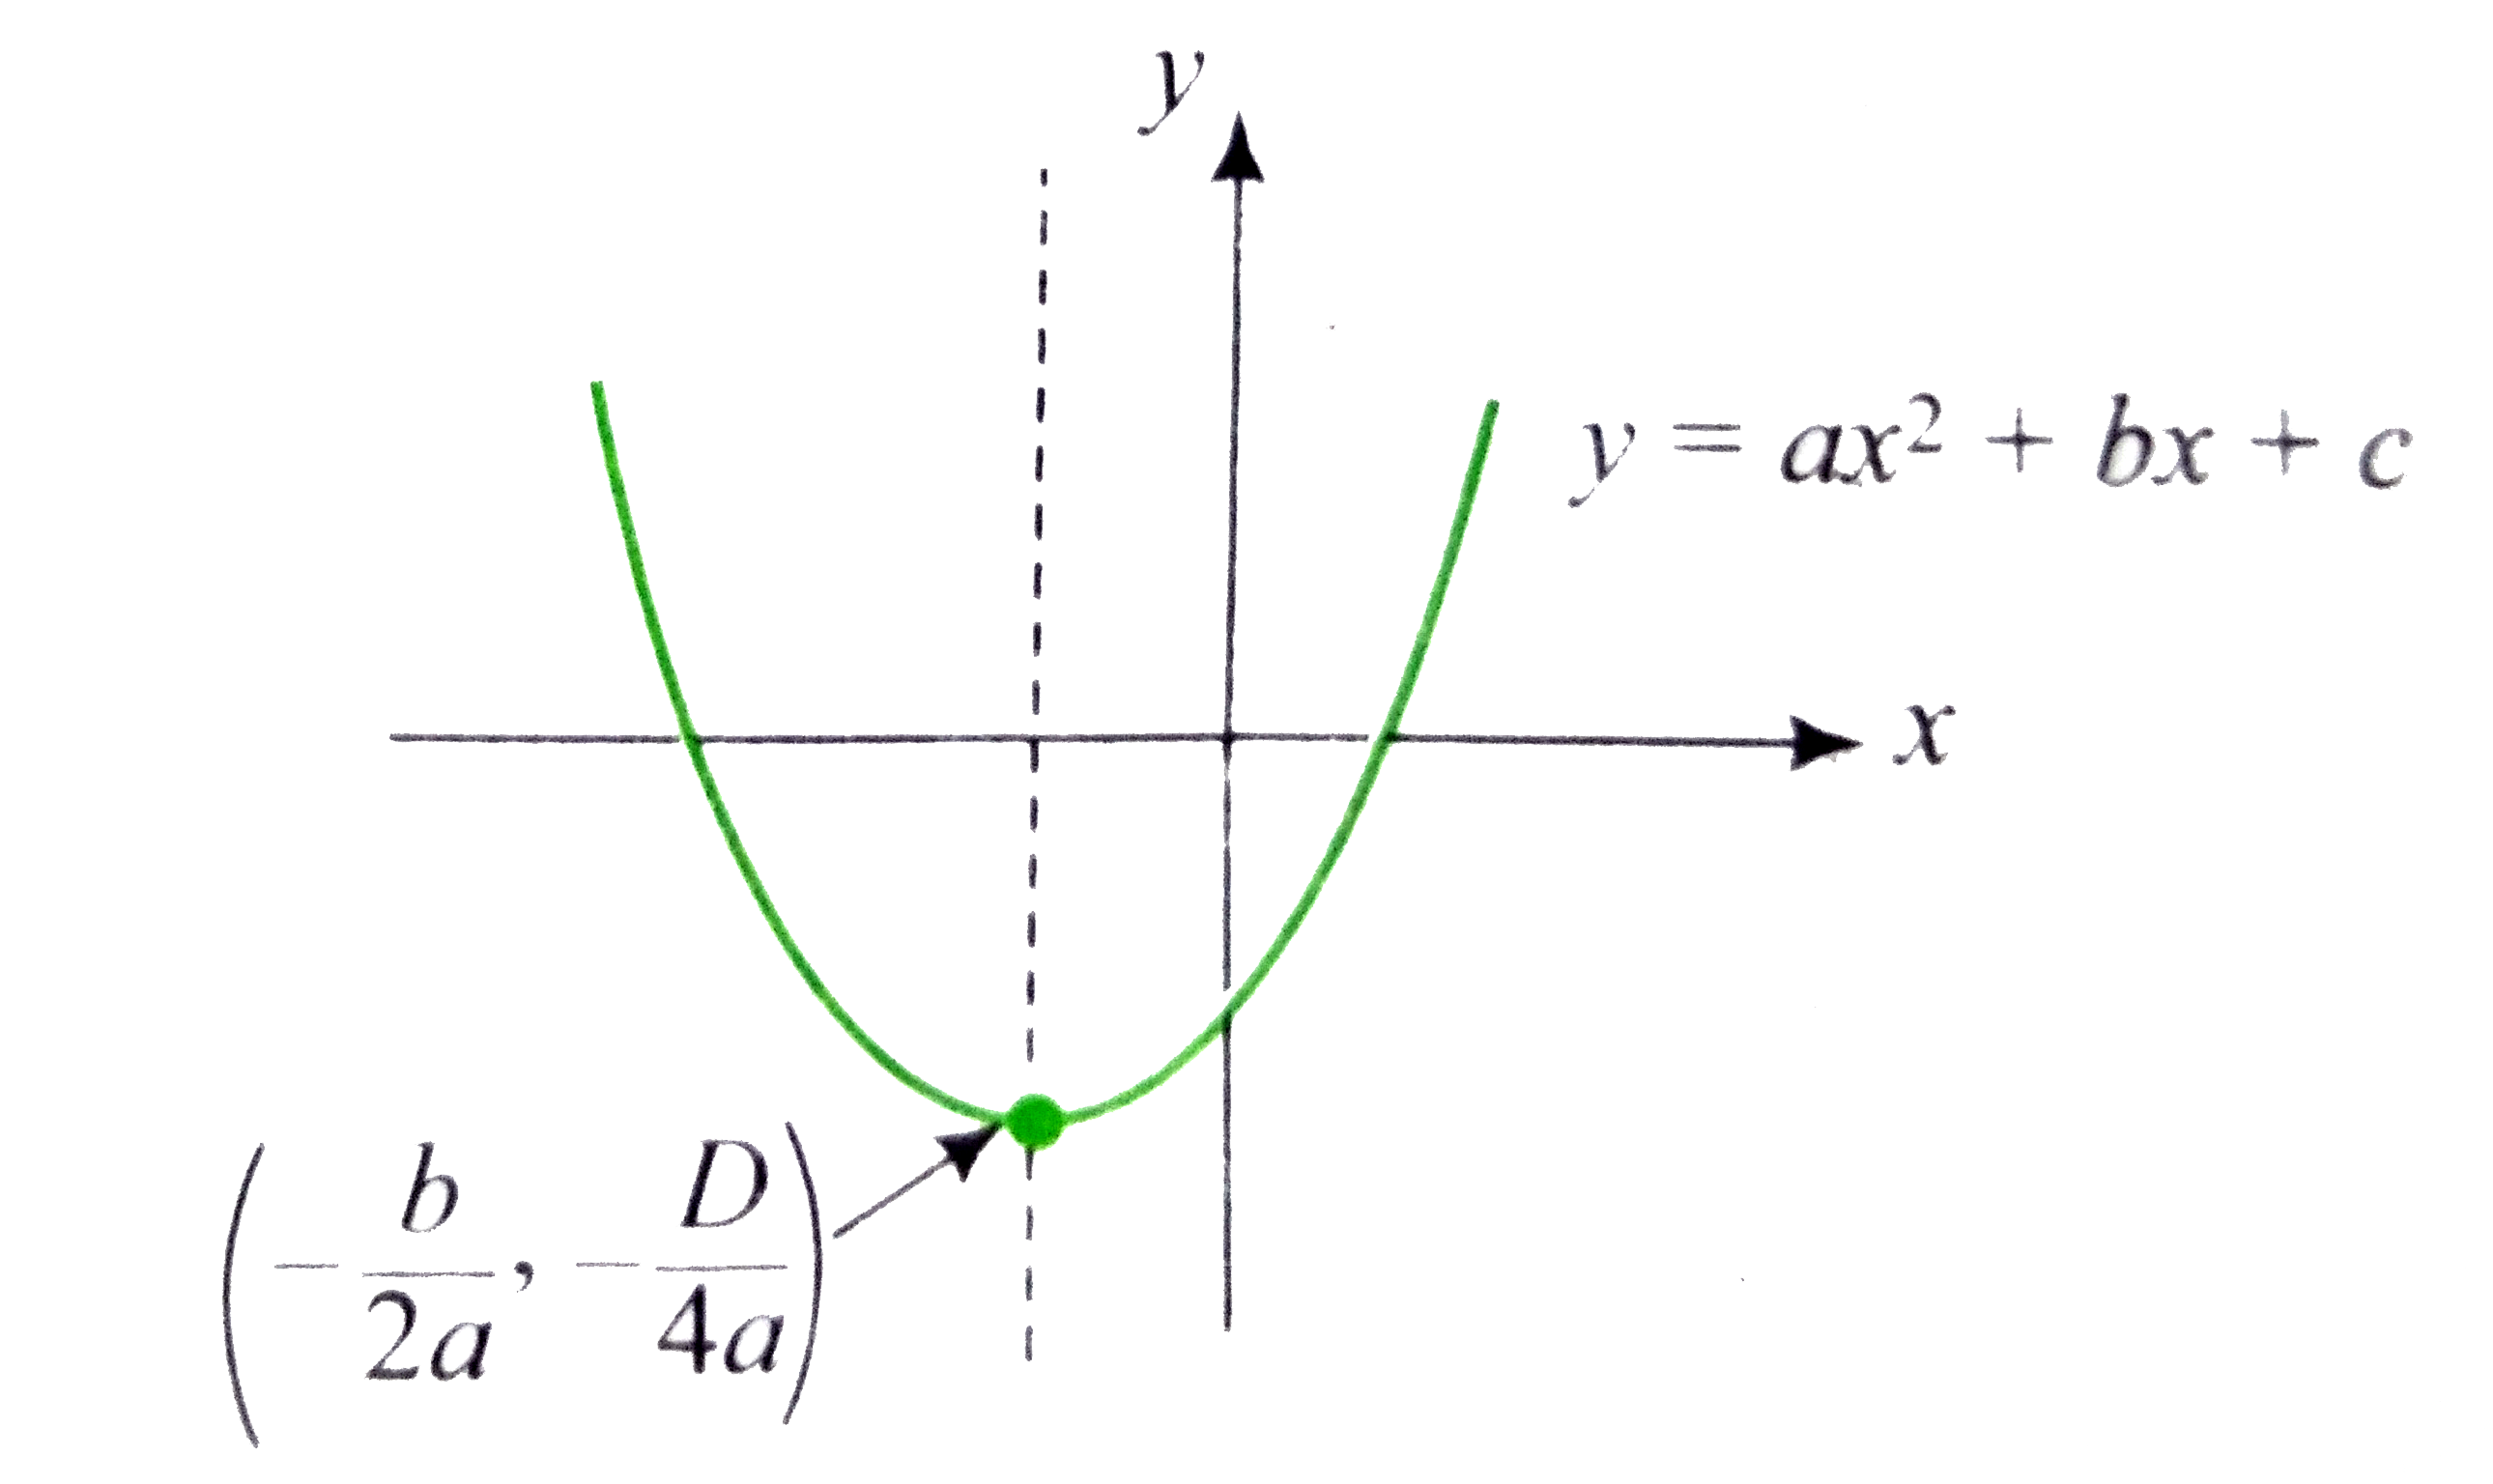
For the diagram, we can see that a>0,c<0and−[b(2a)]<0 .
Hence , b>0
∴a+b−c>0
Topper's Solved these Questions
- BOOK - CENGAGECHAPTER - THEORY OF EQUATIONSEXERCISE - Exercise (Comprehension)37videos
THEORY OF EQUATIONS
- BOOK - CENGAGECHAPTER - THEORY OF EQUATIONSEXERCISE - Exercise (Matrix)6videos
THEORY OF EQUATIONS
- BOOK - CENGAGECHAPTER - THEORY OF EQUATIONSEXERCISE - Exercise (Single)89videos
THEORY OF EQUATIONS
- BOOK - CENGAGECHAPTER - STRAIGHT LINESEXERCISE - JEE Advanced Previous Year4videos
STRAIGHT LINES
- BOOK - CENGAGECHAPTER - THREE DIMENSIONAL GEOMETRYEXERCISE - Question Bank12videos
THREE DIMENSIONAL GEOMETRY
Similar Questions
Consider an unknow polynomial which divided by (x−3) and (x−4) leaves remainder 2 and 1, respectively. Let R(x) be the remainder when this polynomial is divided by (x−3)(x−4).
If equations R(x)=x2+ax+1 has two distint real roots, then exhaustive values of a are.01:37View SolutionMatch the following for the equation x2+a|x|+1=0 where, a is a parameter.
 06:07View Solution
The value of expression x4−8x3+18x2−8x+2 when x=2+√3
02:11View Solutionabout to only mathematics
01:31View SolutionThe equation of the plane which has the property that the point Q(5,4,5) is the reflection of point P(1,2,3) through that plane, is ax+by+cz=d where a,b,c,d∈N. Find the least value of (a+b+c+d).
02:45View SolutionHow many lines of symmetry does the above figure have ?
02:17View SolutionWhich of the following are correct chain isomers of butane ? (i)
05:41View SolutionDetermine the point of symmetry of a regular hexagon.
02:10View SolutionDtermine the images of the following figure about the given line :
02:17View SolutionMatch the following Column A to Column B
 02:10View Solution
Match the following Column A to Column B
 04:23View Solution
Match the following Column A to Column B
 01:13View Solution
The inequation represented by the graph given below is :
01:50View SolutionThe inequation that best describes the graph given below is _________
02:41View SolutionThe inequation that best describes the following graph is _________
03:12View SolutionWhich inequations represent the shaded region in the given figure
02:34View Solution

