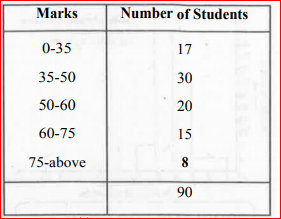
A teacher wanted to analyse the performance of two sections of students in a Mathematics test. She grouped the students into the categories obtaining marks between 0 - 35, 35 - 50, 50 - 60, 60 - 75, 75 and above and formed the following table :  Prepare a histogram to respresent the above data. Solution in Punjabi
Step by step video & image solution for A teacher wanted to analyse the performance of two sections of students in a Mathematics test. She grouped the students into the categories obtaining marks between 0 - 35, 35 - 50, 50 - 60, 60 - 75, 75 and above and formed the following table : Prepare a histogram to respresent the above data. by Maths experts to help you in doubts & scoring excellent marks in Class 9 exams.
Updated on:21/07/2023Topper's Solved these Questions
Similar Questions
The weights (in kg) of 30 students of a class are 49, 48, 46, 48, 48, 50, 52, 53, 54, 43, 43, 41, 43, 55, 56, 48, 47, 41, 40, 49, 51, 51, 56, 46, 45, 44, 49, 53, 42 and 47. Prepare a frequency table for the above data and answer the following questions : What is the least weight ?
View SolutionIf diagonals of a quadrilateral bisect each other at right angles, then it is a :
View SolutionThe floor of a rectangular hall has a perimeter 250 m. If the cost of painting the four walls at the rate of Rs 10 per m2 is Rs 15000, find the height of the hall.
View SolutionHow many lines of symmetry does the above figure have ?
View SolutionWhich of the following are correct chain isomers of butane ? (i)
View SolutionDetermine the point of symmetry of a regular hexagon.
View SolutionDtermine the images of the following figure about the given line :
View SolutionMatch the following Column A to Column B

View SolutionMatch the following Column A to Column B

View SolutionMatch the following Column A to Column B

View SolutionThe inequation represented by the graph given below is :
View SolutionThe inequation that best describes the graph given below is _________
View SolutionThe inequation that best describes the following graph is _________
View SolutionWhich inequations represent the shaded region in the given figure
View SolutionAt x=0, value of (dy)/(dx) is : ltimg src="https://d10lpgp6xz60nq.cloudfront.net/physics_images/ALN_PHY_R04_E01_024_Q01.png" width="80%"gt
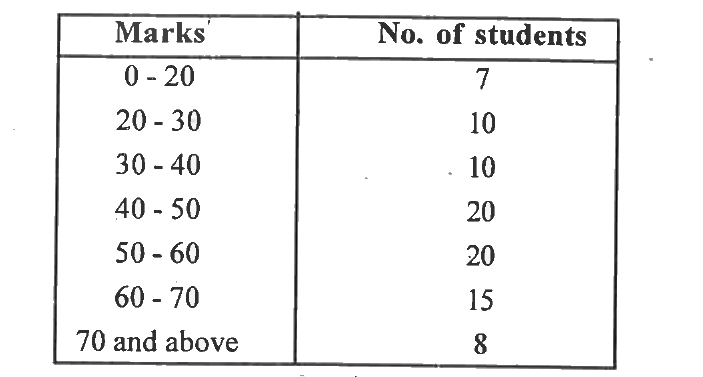
View SolutionA teacher analyses the performance of two sections of students in a mathematics test of 100 marks given in the following table.

Find the probability that a student obtained marks 60 or above.
View Solution
