If we plot the graph between log K and 1/T by Arrhenius Equation, the slope is
- Ea/R
+ Ea/R
- Ea/ 2.303R
+ Ea/ 2.303R
The correct Answer is:C
समान प्रश्न
In the Arrhenius equation, k=Aexp−Ea/RT, A may be termed as the rate constant at…………. .
View SolutionThe temperature dependence of rate constant (k) of a chemical reaction is written in terms of Arrhenius equation, k=Ae−Ea/RT) Activation energy (Ea) of the reaction can be calculate by plotting
View Solution
ज्ञान जांच
A graph plotted between logk versus 1/T for calculating activation energy is shown by
A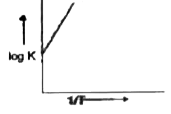 B
B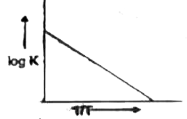 C
C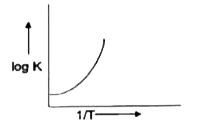 D
D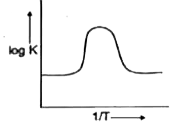
The slope of the plot between pV and p at constant temperature is
AzeroB1C1/2D1/√2A graph plotted between log t50% vs log concentration is a straight line. What conclusion can you draw from this graph?
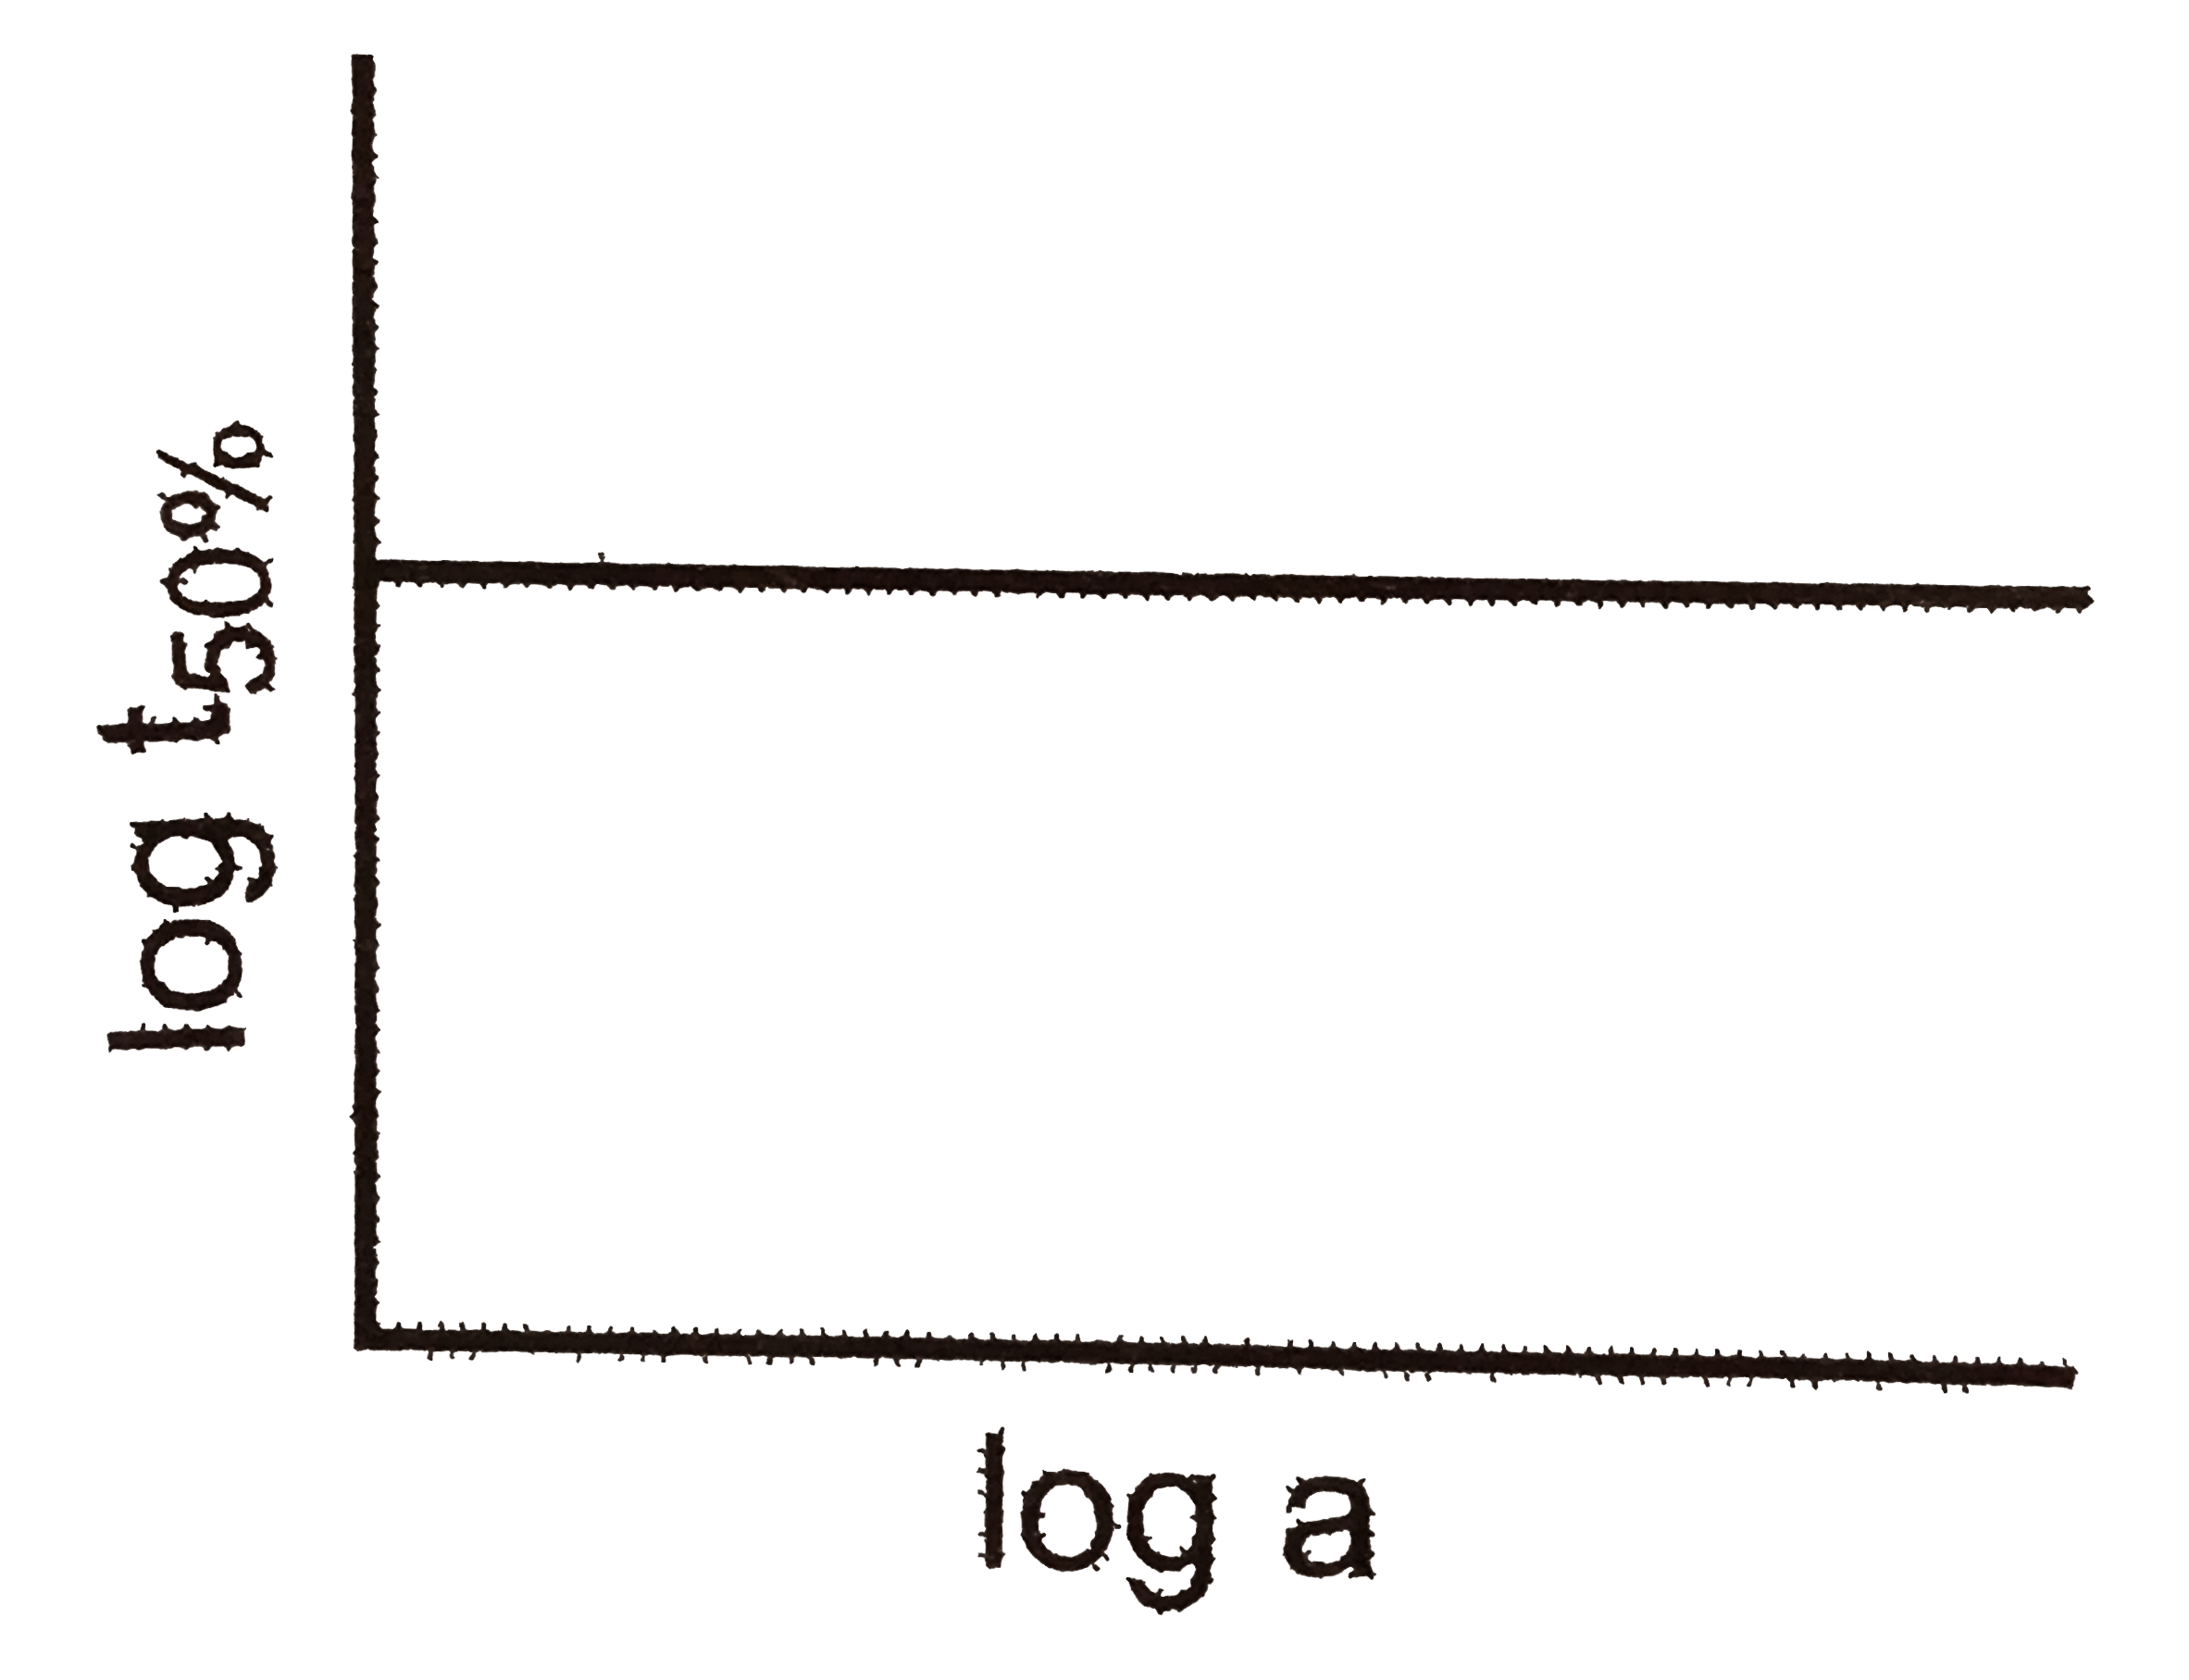 An = 1 , t1/2=1KaBn = 2 , t1/2=1/aCn=1,t1/2=0.693KDNone of these
Slope of the straight line obtained by plotting log10 k against 1/T represents what term ?
View SolutionIn Arrhenius equation , K=Ae−Ea/RT . The A is
View SolutionFor adsorption of a gas on a solid, the plot of log (x/m) vs log P is linear with a slope equal to [n being a whole number]:
View SolutionFor adsorption of a gas on a solid, the plot of log (x/m) vs log P is linear with a slope equal to [n being a whole number]:
View SolutionFor adsorption of a gas on a solid, the plot of log (x/m) vs log P is linear with a slope equal to [n being a whole number]:
View Solution
