CBSE की कक्षा X की परीक्षा में बैठने वाले विद्यार्थियों की संख्या वर्ष 1999-2000 में 91,422 से बढ़कर वर्ष 2008-09 में 116,054 हो गयी। विद्यार्थियों की संख्या में यह वृद्धि लगभग 27% है।
Step by step video & image solution for CBSE की कक्षा X की परीक्षा में बैठने वाले विद्यार्थियों की संख्या वर्ष 1999-2000 में 91,422 से बढ़कर वर्ष 2008-09 में 116,054 हो गयी। विद्यार्थियों की संख्या में यह वृद्धि लगभग 27% है। by Maths experts to help you in doubts & scoring excellent marks in Class 8 exams.
Updated on:21/07/2023Topper's Solved these Questions
- राशियों की तुलना BOOK - NCERT EXEMPLAR HINDICHAPTER - राशियों की तुलना EXERCISE - अनुप्रयोग, खेल और पहेलियाँ
4 Videos
- राशियों की तुलना BOOK - NCERT EXEMPLAR HINDICHAPTER - राशियों की तुलना EXERCISE - अनुप्रयोग, खेल और पहेलियाँ
4 Videos
- बीजीय व्यंजक, सर्वसमिकाएँ और गुणनखंडनBOOK - NCERT EXEMPLAR HINDICHAPTER - बीजीय व्यंजक, सर्वसमिकाएँ और गुणनखंडनEXERCISE - अनुप्रयोग
1 Videos
- वर्ग-वर्गमूल तथा घन-घनमूल BOOK - NCERT EXEMPLAR HINDICHAPTER - वर्ग-वर्गमूल तथा घन-घनमूल EXERCISE - प्रश्न
14 Videos
Similar Questions
रिक्त स्थान भरिए

View Solutionरिक्त स्थान भरिए

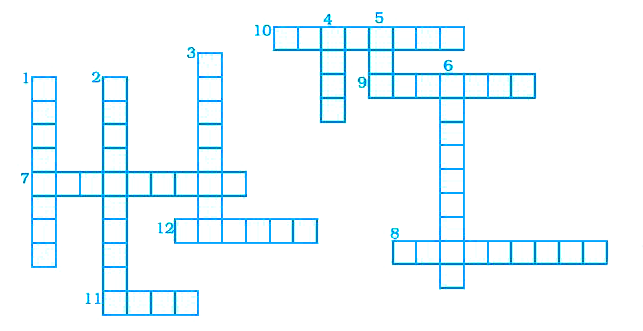
View Solutionक्रॉसवर्ड पहेली दिये हुए क्रॉसवर्ड को हल कीजिए और फिर दिये खानों को भरिए। एक्रॉस और डाउन दोनों को भरने के लिए संकेत नीचे दिये गए हैं। साथ ही, एक्रॉस और डाउन के संकेतों वाली संख्याएँ संगत खानों के कोनों पर लिखी हैं। संकेतों के उत्तर अंग्रेजी के अक्षरों में संगत खानों में भरिए।
डाउन
1. A polynomial with two terms.
1. दो पदों का एक बहुपद।
2. An expression containing one or more terms with non-zero coefficient (with variables having non-negative exponents).
2. एक या अधिक पदों वाला व्यंजक जिसके चरों में केवल ऋणेतर पूर्णांकीय घातांक हों।
3. To find the value of a mathematical expression.
3. एक गणितीय व्यंजक का मान निकालना।
4. A_____ is formed by the product of variables and constants.
4. चरों और अचरों के गुणनफल से एक ___ बनता है।
5. The abbreviation of the greatest no. (or expression) that in a factor of two or more numbers.
5. दो या अधिक संख्याओं (व्यंजकों) में सबसे बड़े सार्व गुणनखंड का संक्षिप्त रूप।
6. A polynomial with three terms.
6. तीन पदों वाला बहुपद।
एक्रॉस
7. A polynomial with only one term.
7. केवल एक पद वाला बहुपद।
8. An expression of the second degree.
8. घात 2 का एक व्यंजक।
9. Terms can be written as product of its_____
9. पदों को उसके _____ के गुणनफल के रूप में लिखा जा सकता है।
10. The numbers .......... −3,−2,−1,0,1,2,3 .......... are known as _______
10. संख्याएँ .......... −3,−2,−1,0,1,2,3 _____ कहलाती हैं। 11. terms are formed from the some variables and the powers of this variables are the same term.
11. _____ पद समान चरों से बनते हैं तथा इनमें चरों की घातें भी समान होती हैं।
12. The highest power of a polynomial is called the _____ of the polynomial.
12. किसी बहुपद के सभी पदों में संबद्ध चरों की सबसे बड़ी घात उस बहुपद की कहलाती है।

View Solutionबताइए की एक पूर्ण वर्ग का क्या अर्थ है। एक उदाहरण दीजिए।
View Solutionयह ज्ञात है की महाविद्यालय के छात्रों में से 60 % छात्रावास में रहते है और 40 % छात्रावास में नहीं रहते है । पूर्ववर्ती वर्ष से परिणाम सूचित करते है की छात्रावास में रहने वाले छात्रों में से30 % छात्रों में से 20 % छात्रों ने A ग्रेड लिए। वर्ष के अंत में महाविद्यालय के एक छात्र को यादृच्छया चुना गया और पाया गया की उसे A ग्रेड मिला है । इस बात की क्या प्रायिकता है की वह छात्रावास में रहने वाला है ?
View SolutionStudy the following pie chart and table to answer the question.Total number of students admitted in a university in various fields = 5000 Distribution of the number of students into various fields: The ratio of the number of boys in Economics to the number of students in Economics is: निम्नांकित पाई चार्ट का अध्ययन कीजिए और उसके बाद दिए गए प्रशन का उत्तर दीजिए। एक विश्वविद्यालय में विभिन्न संकायों में प्रवेश लेने वाले विद्यार्थियों की संख्या 5000 है। विभिन्न संकायों में विद्यार्थियों को संख्या का बंटनः इकोनॉमिक्स में लड़कों की संख्या का, इकोनॉमिक्स में कुल विद्यार्थियों की संख्या से क्या अनुपात हे?
View Solutionविद्यार्थियों की एक पंक्ति में , सोहन का स्थान दोनों मे से किसी भी किनारे से 9 वाँ है तब विद्यार्थियों की कुल संख्या होगी ?
View Solutionकिसी कक्षा में रवि ने किसी परीक्षा में ऊपर से पाँचवा स्थान हासिल किया और नीचे से 25 वाँ स्थान हासिल किया तब कक्षा में कुल विद्यार्थियों की संख्या क्या होगी ?
View Solution(x+y)^n में पदों की संख्या
View SolutionThe given Bar Graph presents the number of students of two schools for six years. दिया गया दंड आरेख छः वर्ष की अवधि में दो विद्यालयों में छात्रों की संख्या को दर्शाता है | In which year, the percentage increase in students in school B is the highest in comparison to its previous year? किस वर्ष में, विद्यालय B में छात्रों की संख्या में प्रतिशत वृद्धि इसके पिछले वर्ष की तुलना में सबसे अधिक रही है?
View SolutionThe given Bar Graph presents the number of students of two schools for six years. दिया गया दंड आरेख छः वर्ष की अवधि में दो विद्यालयों में छात्रों की संख्या को दर्शाता है | In which year, the percentage increase of students in school A is the highest in comparison to its previous year? किस वर्ष, विद्यालय A में छात्रों की संख्या में प्रतिशत वृद्धि पिछले वर्ष की तुलना में सर्वाधिक है ?
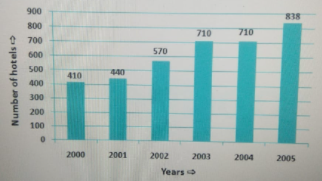
View SolutionStudy the chart and answer the questions:
In which of the given years is the percentage increase in the number of hotels in comparison to the previous year, is the maximum?
चार्ट का अध्ययन करें और प्रश्नों का उत्तर दें:पिछले वर्ष की तुलना में होटलों की संख्या में किस वर्ष में अधिकतम प्रतिशत वृद्धि हुई है?
View SolutionThe given Bar Graph presents the number of students enrolled for vocational course institutes A and B during a period of 5 years. In which year the number of students enrolled in B is x% more, where 25 lt x lt 30 , then the number of students enrolled in A in the same year? दिया गया दंड आरेख (बार ग्राफ) 5 वर्ष की अवधि के दौरान संस्थान A और B में व्यावसायिक पाठ्यक्रम के लिए नामांकित विद्यार्थियों की संख्या को दर्शाता है| किस वर्ष में संस्थान B में नामांकित विद्यार्थियों की संख्या उसी वर्ष संस्थान A में नामांकित विद्यार्थियों की संख्या से x % अधिक है, जहां 25 lt x lt 30 है?
View SolutionThe given Bar Graph presents the number of students of two schools for six years. दिया गया दंड आरेख (बार ग्राफ) छह वर्षो के दौरान दो स्कूलों में विद्यार्थियों की संख्या को दर्शाता है| In which year, the percentage increase in students in school B is the highest in comparison to its previous year? किस वर्ष में, स्कूल B के विद्यार्थियों की संख्या में प्रतिशत वृद्धि इसके पिछले वर्ष की तुलना में सबसे अधिक है?
View SolutionThe given Bar Graph presents the number of students of two schools for six years. दिया गया दंड आरेख (बार ग्राफ) छह वर्षो के दौरान दो स्कूलों में विद्यार्थियों की संख्या को दर्शाता है| In which year, percentage increase of students in school A is the highest in comparison to its previous year ? किस वर्ष में, स्कूल A की विद्याथियों की संख्या में प्रतिशत वृद्धि इसके पिछले वर्ष की तुलना में सबसे अधिक है?
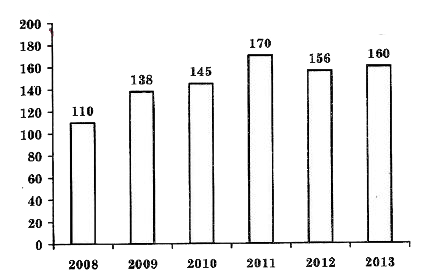
View SolutionStudy the following frequency polygon and answer the questions. Given a line graph showing the number of students passed in Higher Secondary Examination in a school over the years 2008 to 2013:

The increase in percentage of passed students from 2008 to 2011 approximately is.
निम्नलिखित बारम्बारता बहुभुज का अध्ययन करें और दिए गए प्रश्नों के उत्तर दें। नीचे रेखा ग्राफ में एक स्कूल में वर्ष 2008 से 2018 तक के वर्षों में उच्चतर माध्यमिक परीक्षा में उत्तीर्ण होने वाले विद्यार्थियों की संख्या दर्शायी गई है :
वर्ष 2008 से 2011 तक उत्तीर्ण होने वाले विद्यार्थियों की प्रतिशतता में लगभग कितनी वृद्धि हुई है?
View Solution
