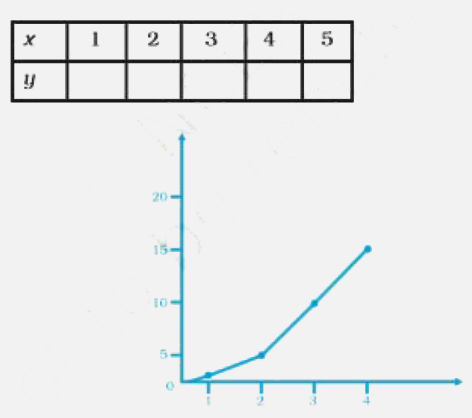
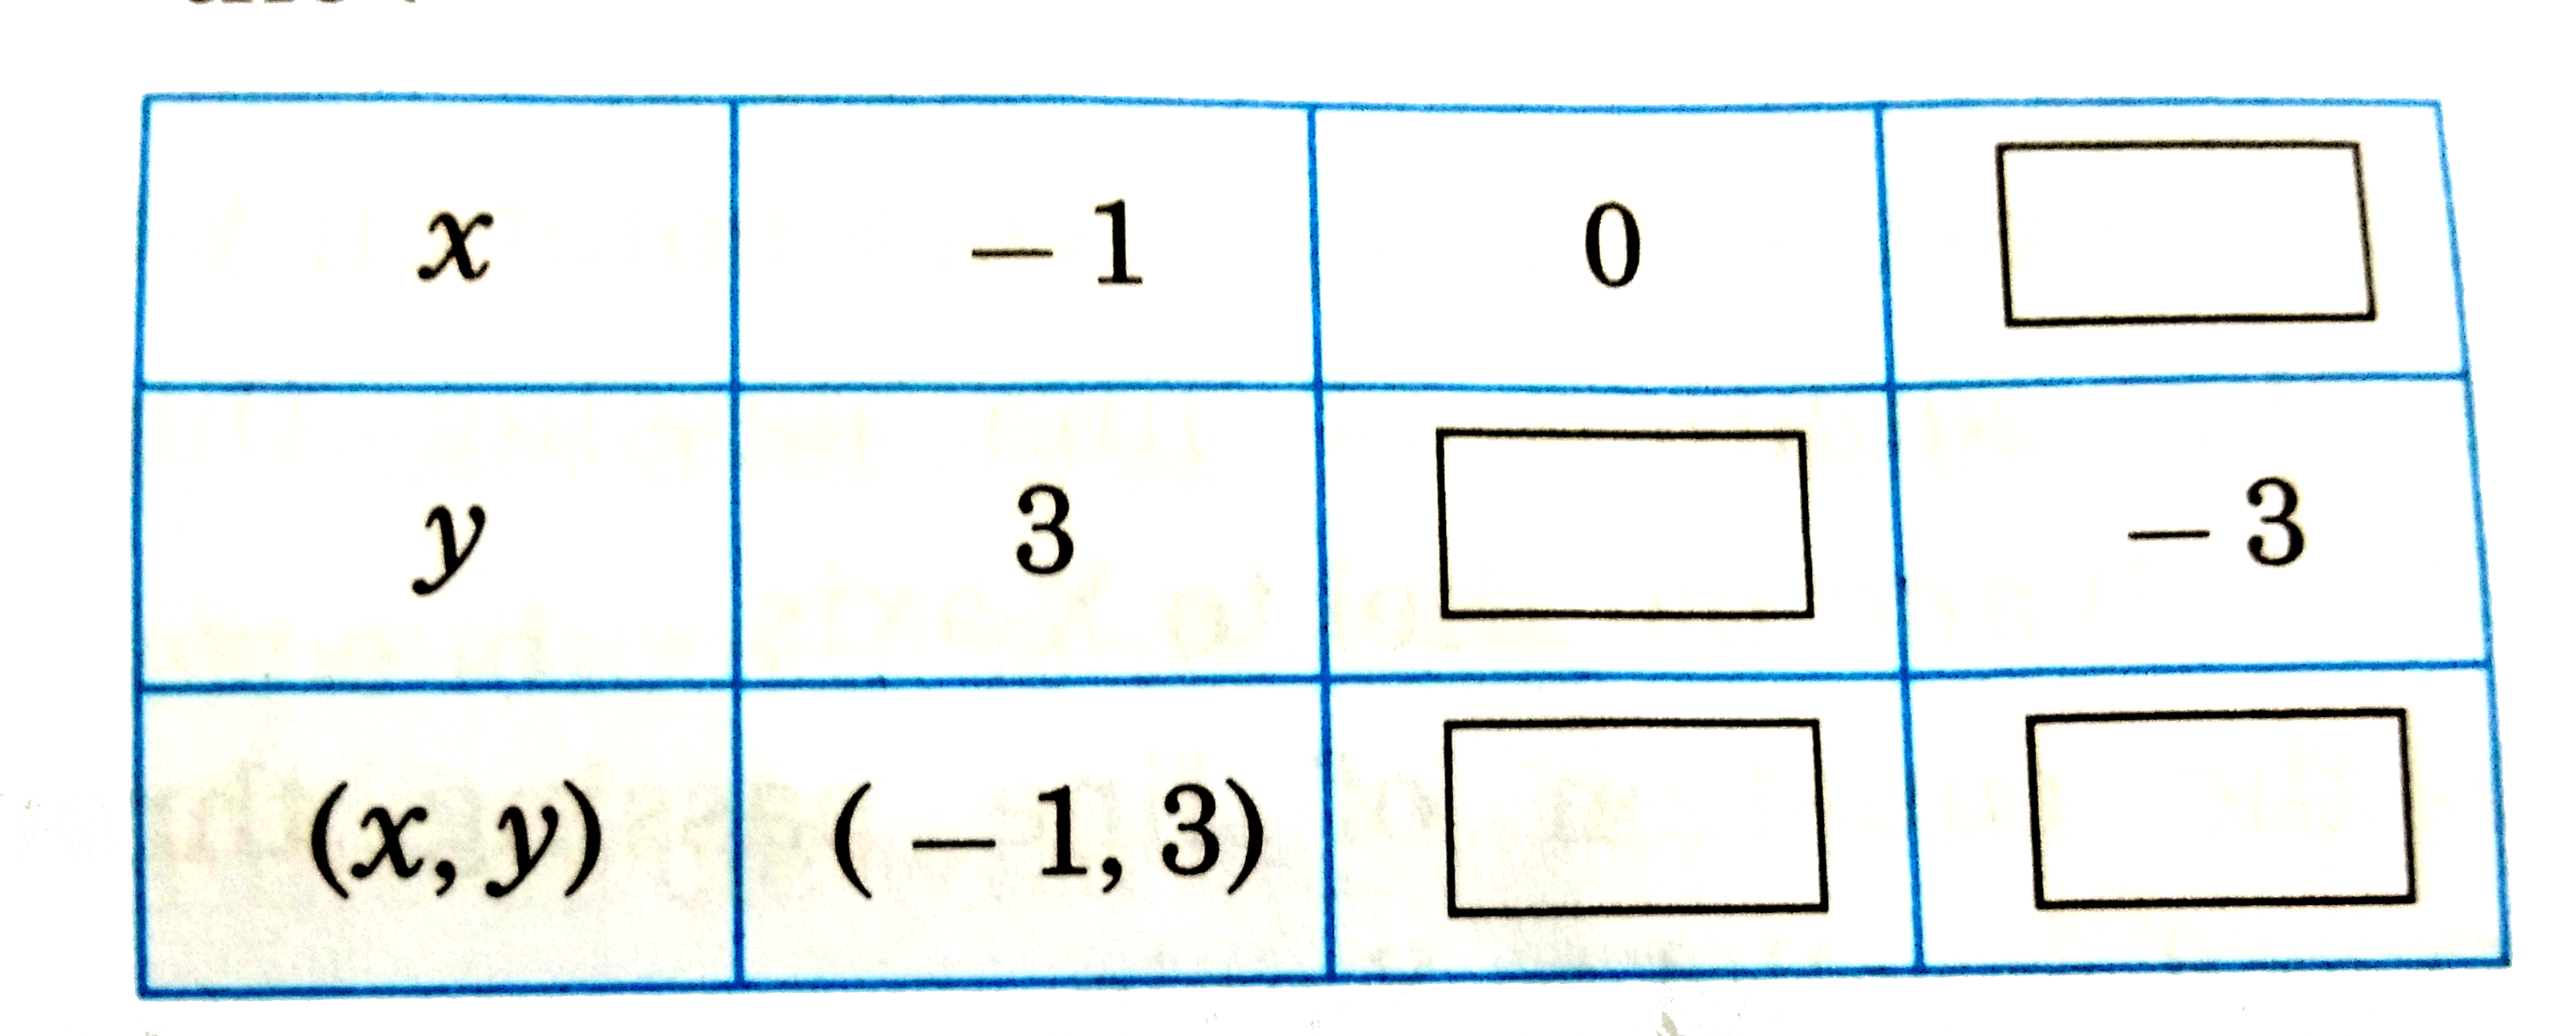
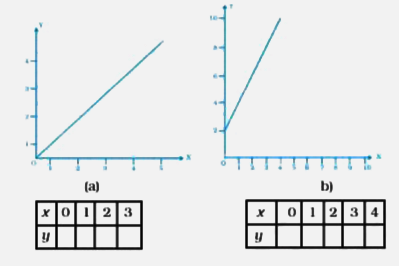
Study the given graphs (a) and (b) and complete the corresponding tables below.
Video Solution
|
Answer
Step by step video & image solution for Study the given graphs (a) and (b) and complete the corresponding tables below. by Maths experts to help you in doubts & scoring excellent marks in Class 8 exams.
Updated on:21/07/2023Topper's Solved these Questions
- INTRODUCTION TO GRAPHS BOOK - NCERT EXEMPLARCHAPTER - INTRODUCTION TO GRAPHS EXERCISE - THINK AND DISCUSS
4 Videos
- EXPONENTS AND POWERSBOOK - NCERT EXEMPLARCHAPTER - EXPONENTS AND POWERSEXERCISE - EXERCISE
195 Videos
- LINEAR EQUATIONS IN ONE VARIABLEBOOK - NCERT EXEMPLARCHAPTER - LINEAR EQUATIONS IN ONE VARIABLEEXERCISE - THINK AND DISCUSS
3 Videos
Similar Questions
Knowledge Check
Study the following graph carefully and answer the questions given below it -----
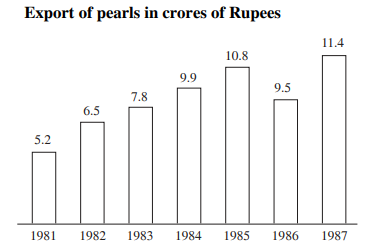
In how many years was the export above the average for the given period ?A2B3C4D5Study the following graph carefully and answer the questions given below
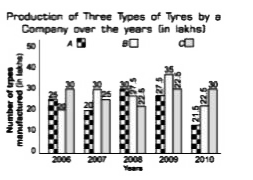
In which of the following years, was the percentage production of B type to C type the maximum?A2008B2009C2010D2007Study the following graph carefully and answer the questions given below
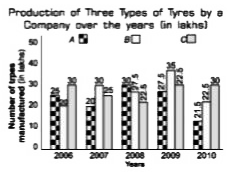
What was the difference between the number of B type tyres manufactured in 2008 and 2009?A100000B2000000C1000000Dnone to these
Study the given table and select the correct option :
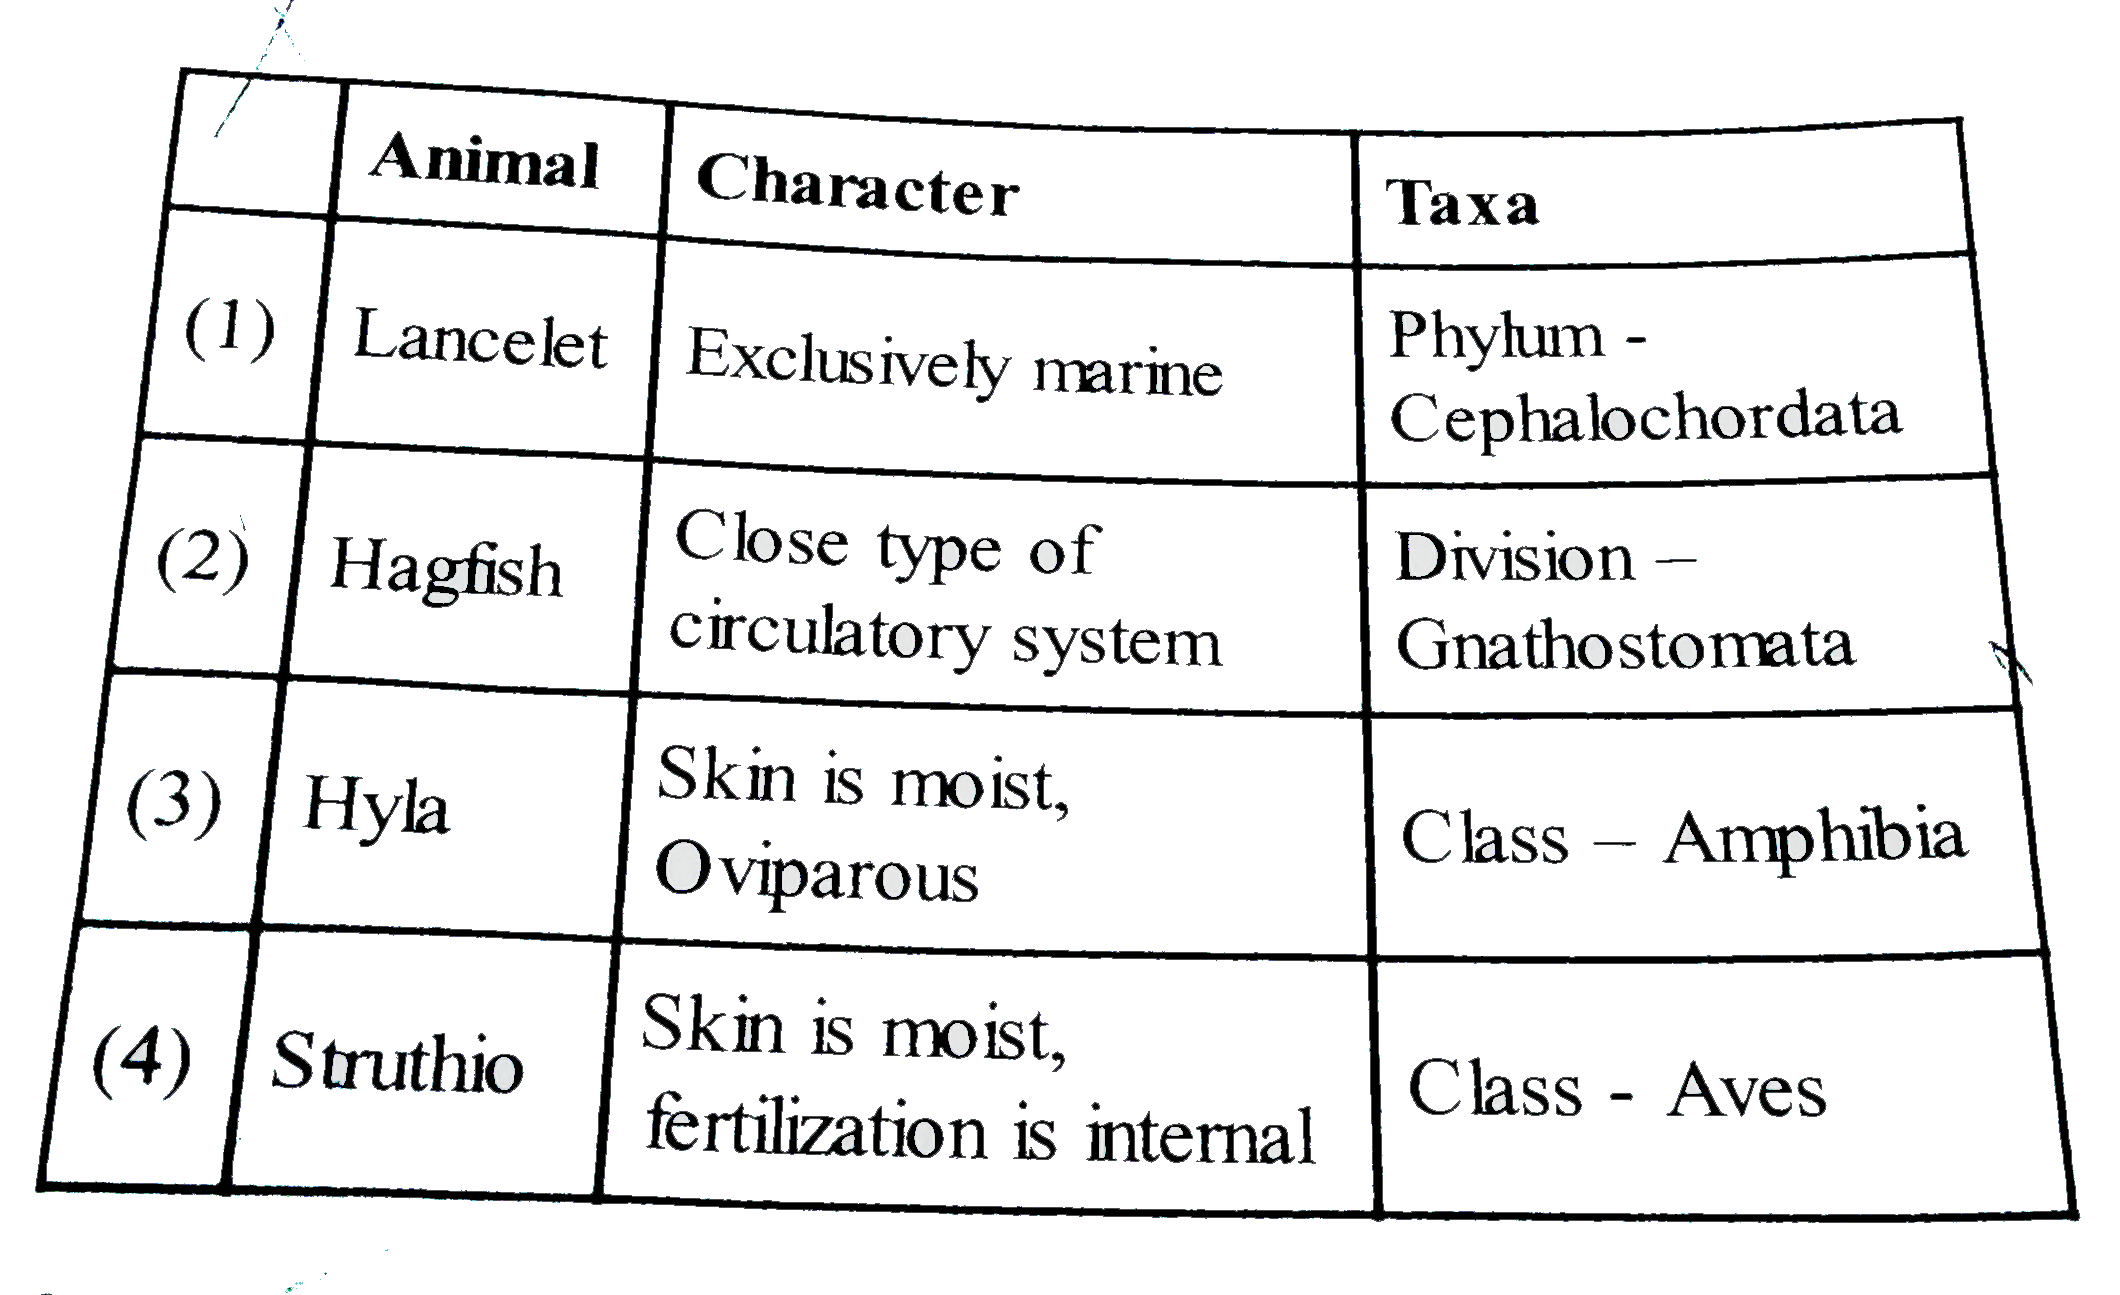
View SolutionComplete the table given below.
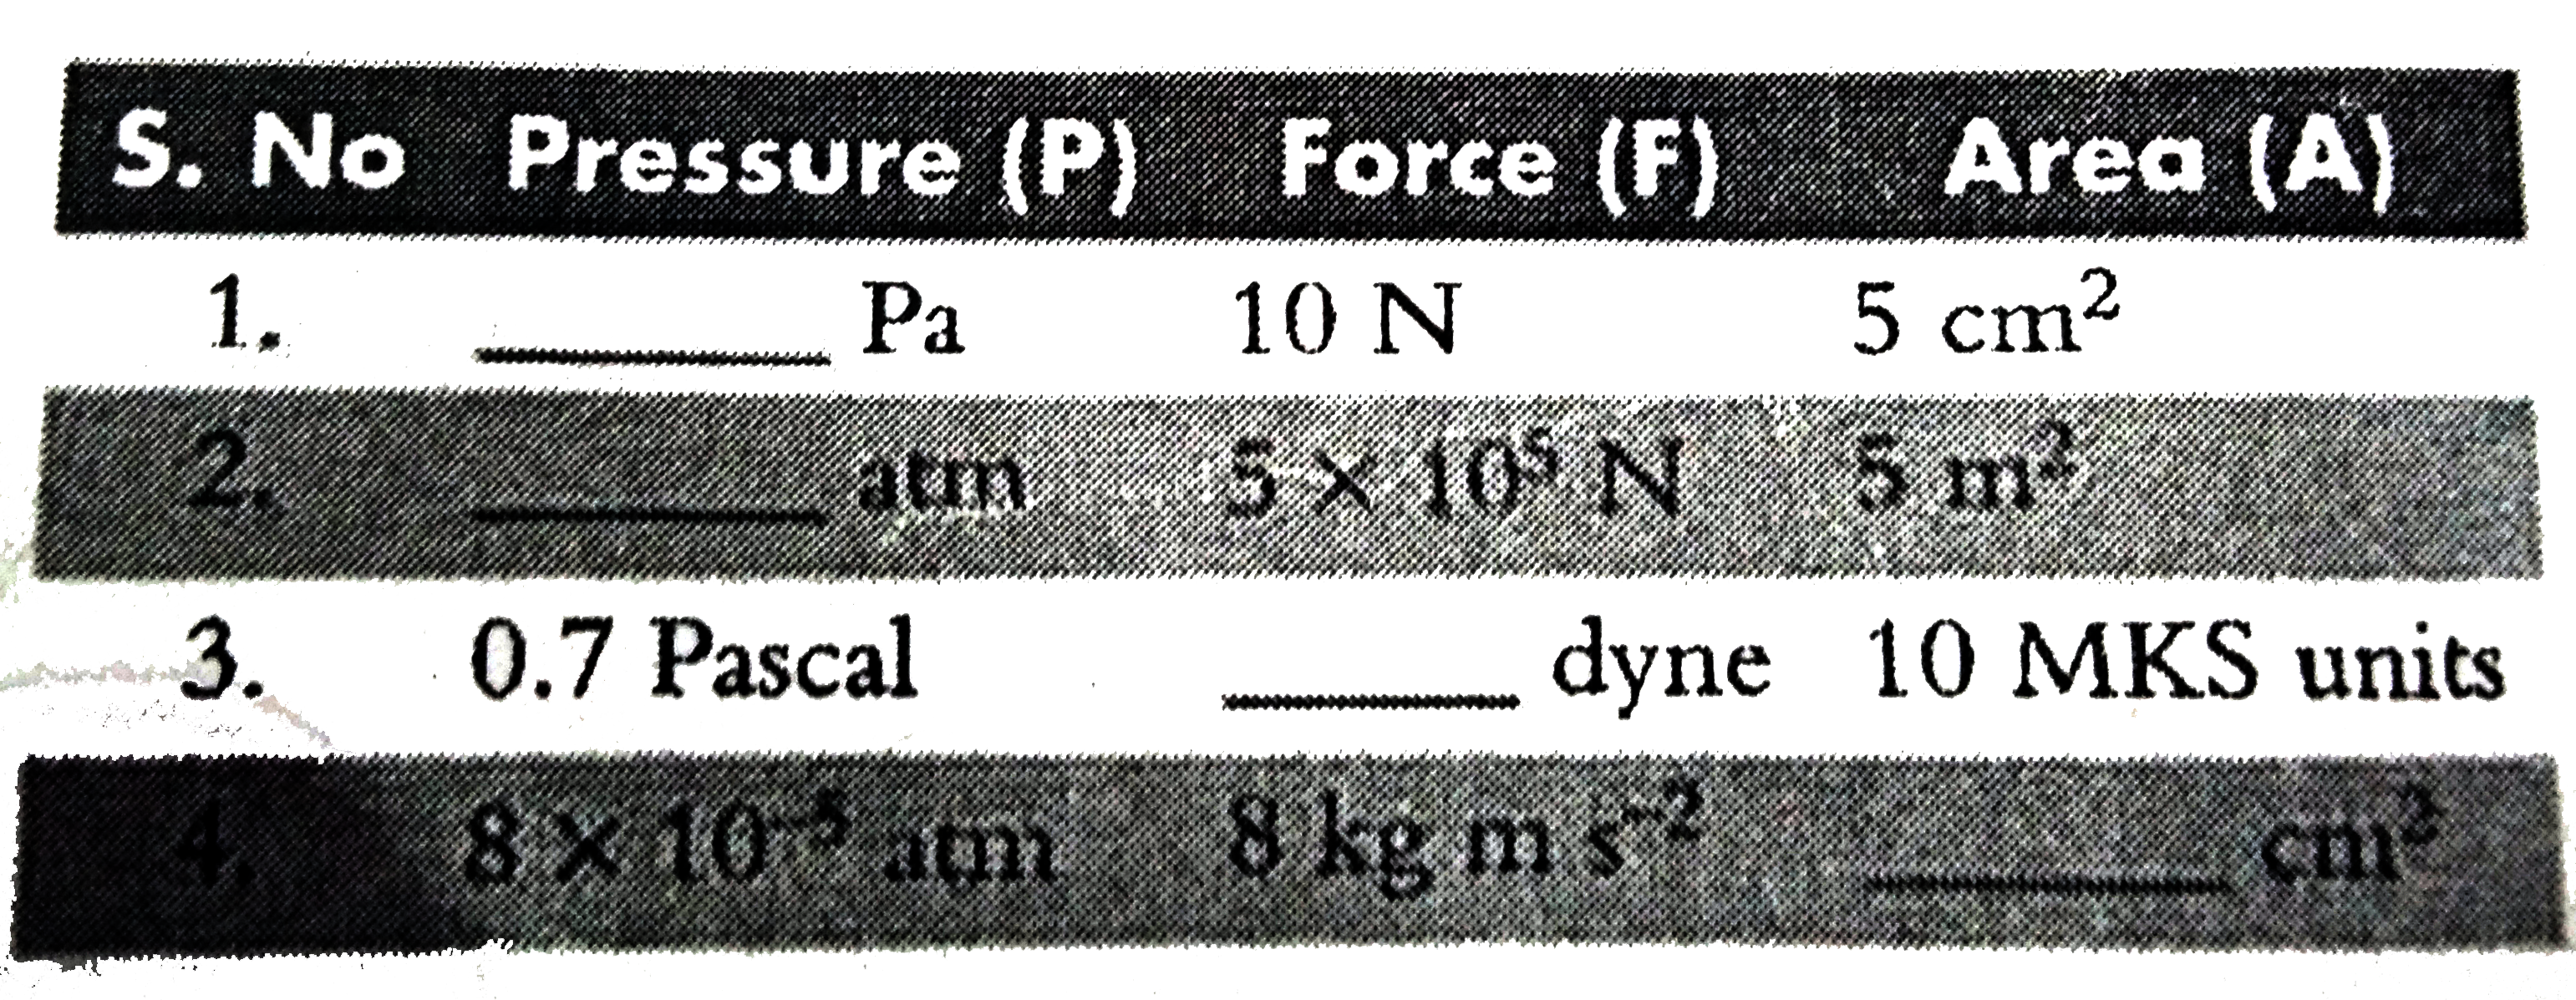
View SolutionComplete the table given below:
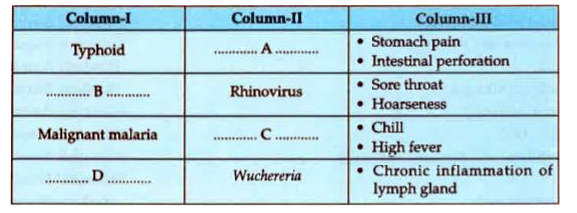
View SolutionComplete the given table
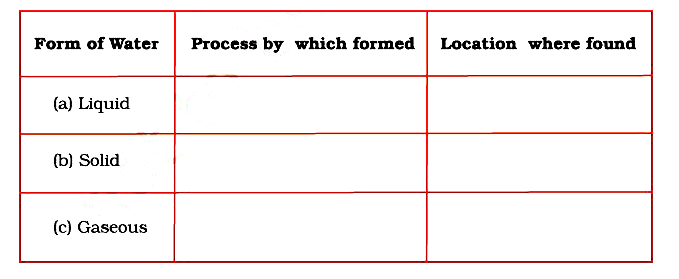
View SolutionStudy the following graph carefully and answer the questions given below it -----
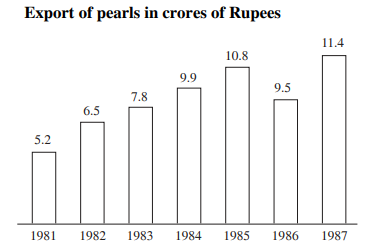
What was the percentage increase in export from 1986 to 1987 ?
View Solution

