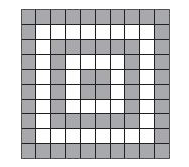
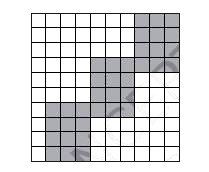
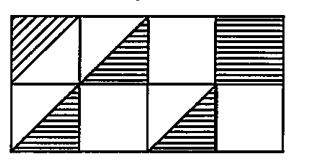
The per cent that represents the shaded region in the figure is
A
36%
B
64%
C
27%
D
48%
Video Solution
|
Answer
Step by step video & image solution for The per cent that represents the shaded region in the figure is by Maths experts to help you in doubts & scoring excellent marks in Class 7 exams.
Updated on:21/07/2023Topper's Solved these Questions
- COMPARING QUANTITIESBOOK - NCERT EXEMPLARCHAPTER - COMPARING QUANTITIESEXERCISE - THINK AND DISCUSS
24 Videos
- COMPARING QUANTITIESBOOK - NCERT EXEMPLARCHAPTER - COMPARING QUANTITIESEXERCISE - THINK AND DISCUSS
24 Videos
- ALGEBRAIC EXPRESSIONSBOOK - NCERT EXEMPLARCHAPTER - ALGEBRAIC EXPRESSIONSEXERCISE - Check understanding
1 Video
- DATA HANDLINGBOOK - NCERT EXEMPLARCHAPTER - DATA HANDLINGEXERCISE - THINK AND DISCUSS
3 Videos
Similar Questions
Knowledge Check
The shaded region in the given figure is
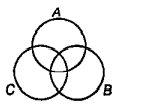 AA∩(B∪C)BA∪(B∩C)CA∩(B−C)DA−(B∪C)
The shaded region in the given figure is
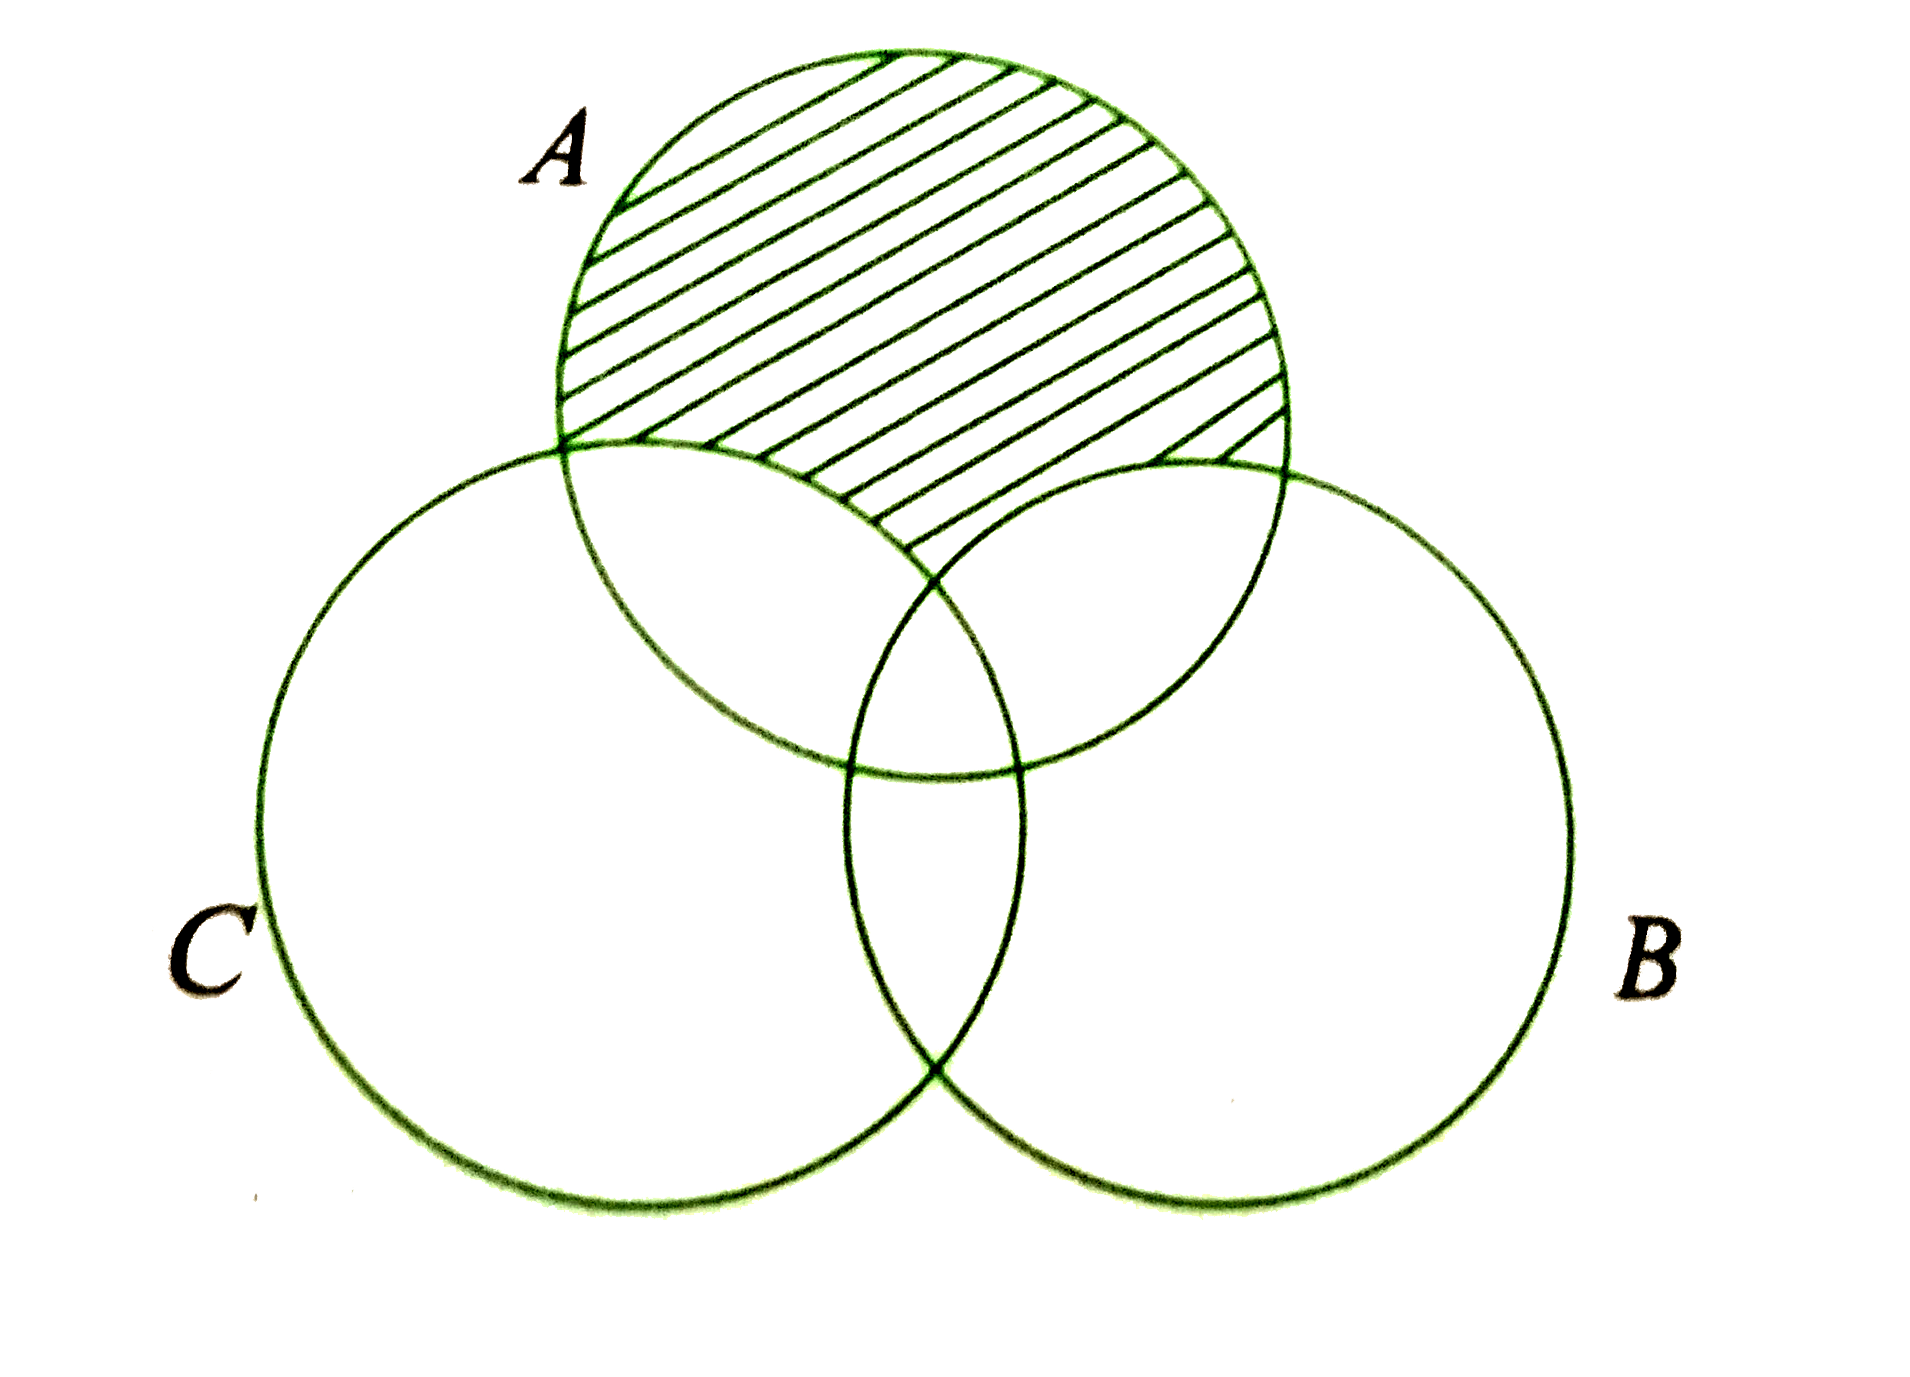 AA∩(B∪C)BA∪(B∩C)CA∩(B−C)DA−(B∪C)
The shaded region in the given figure is
 AA∩(B∪C)BA∪(B∩C)CA∩(B−C)DA−(B∪C)
The area of the shaded region shown in the figure is
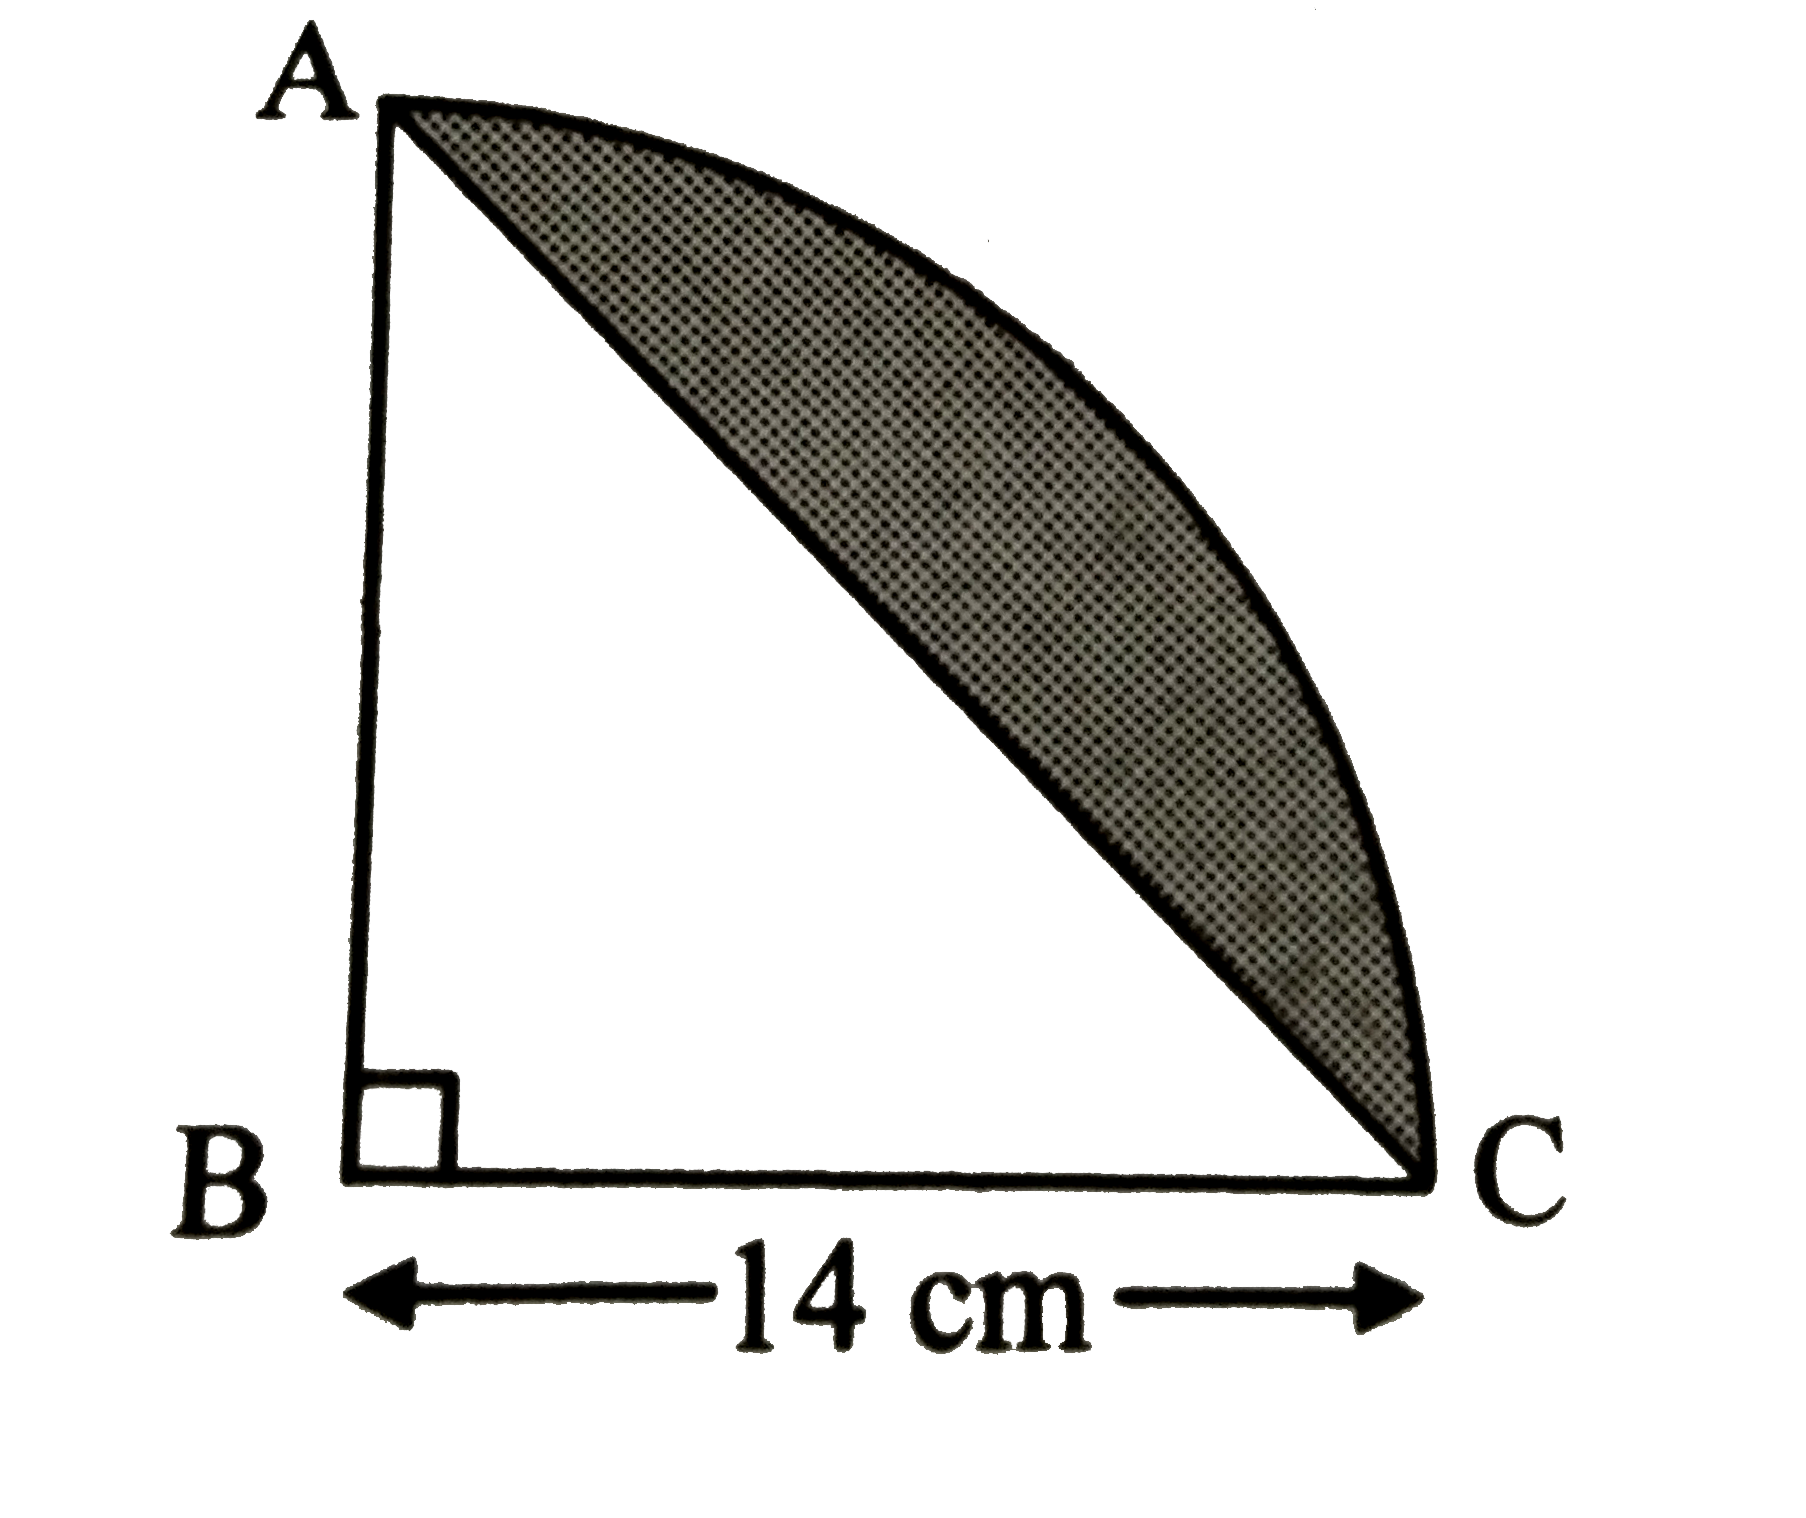
View Solutionarea of the shaded region in given figure ?
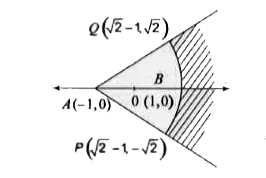
View SolutionInequations that represents the shaded region of the following graph is ____
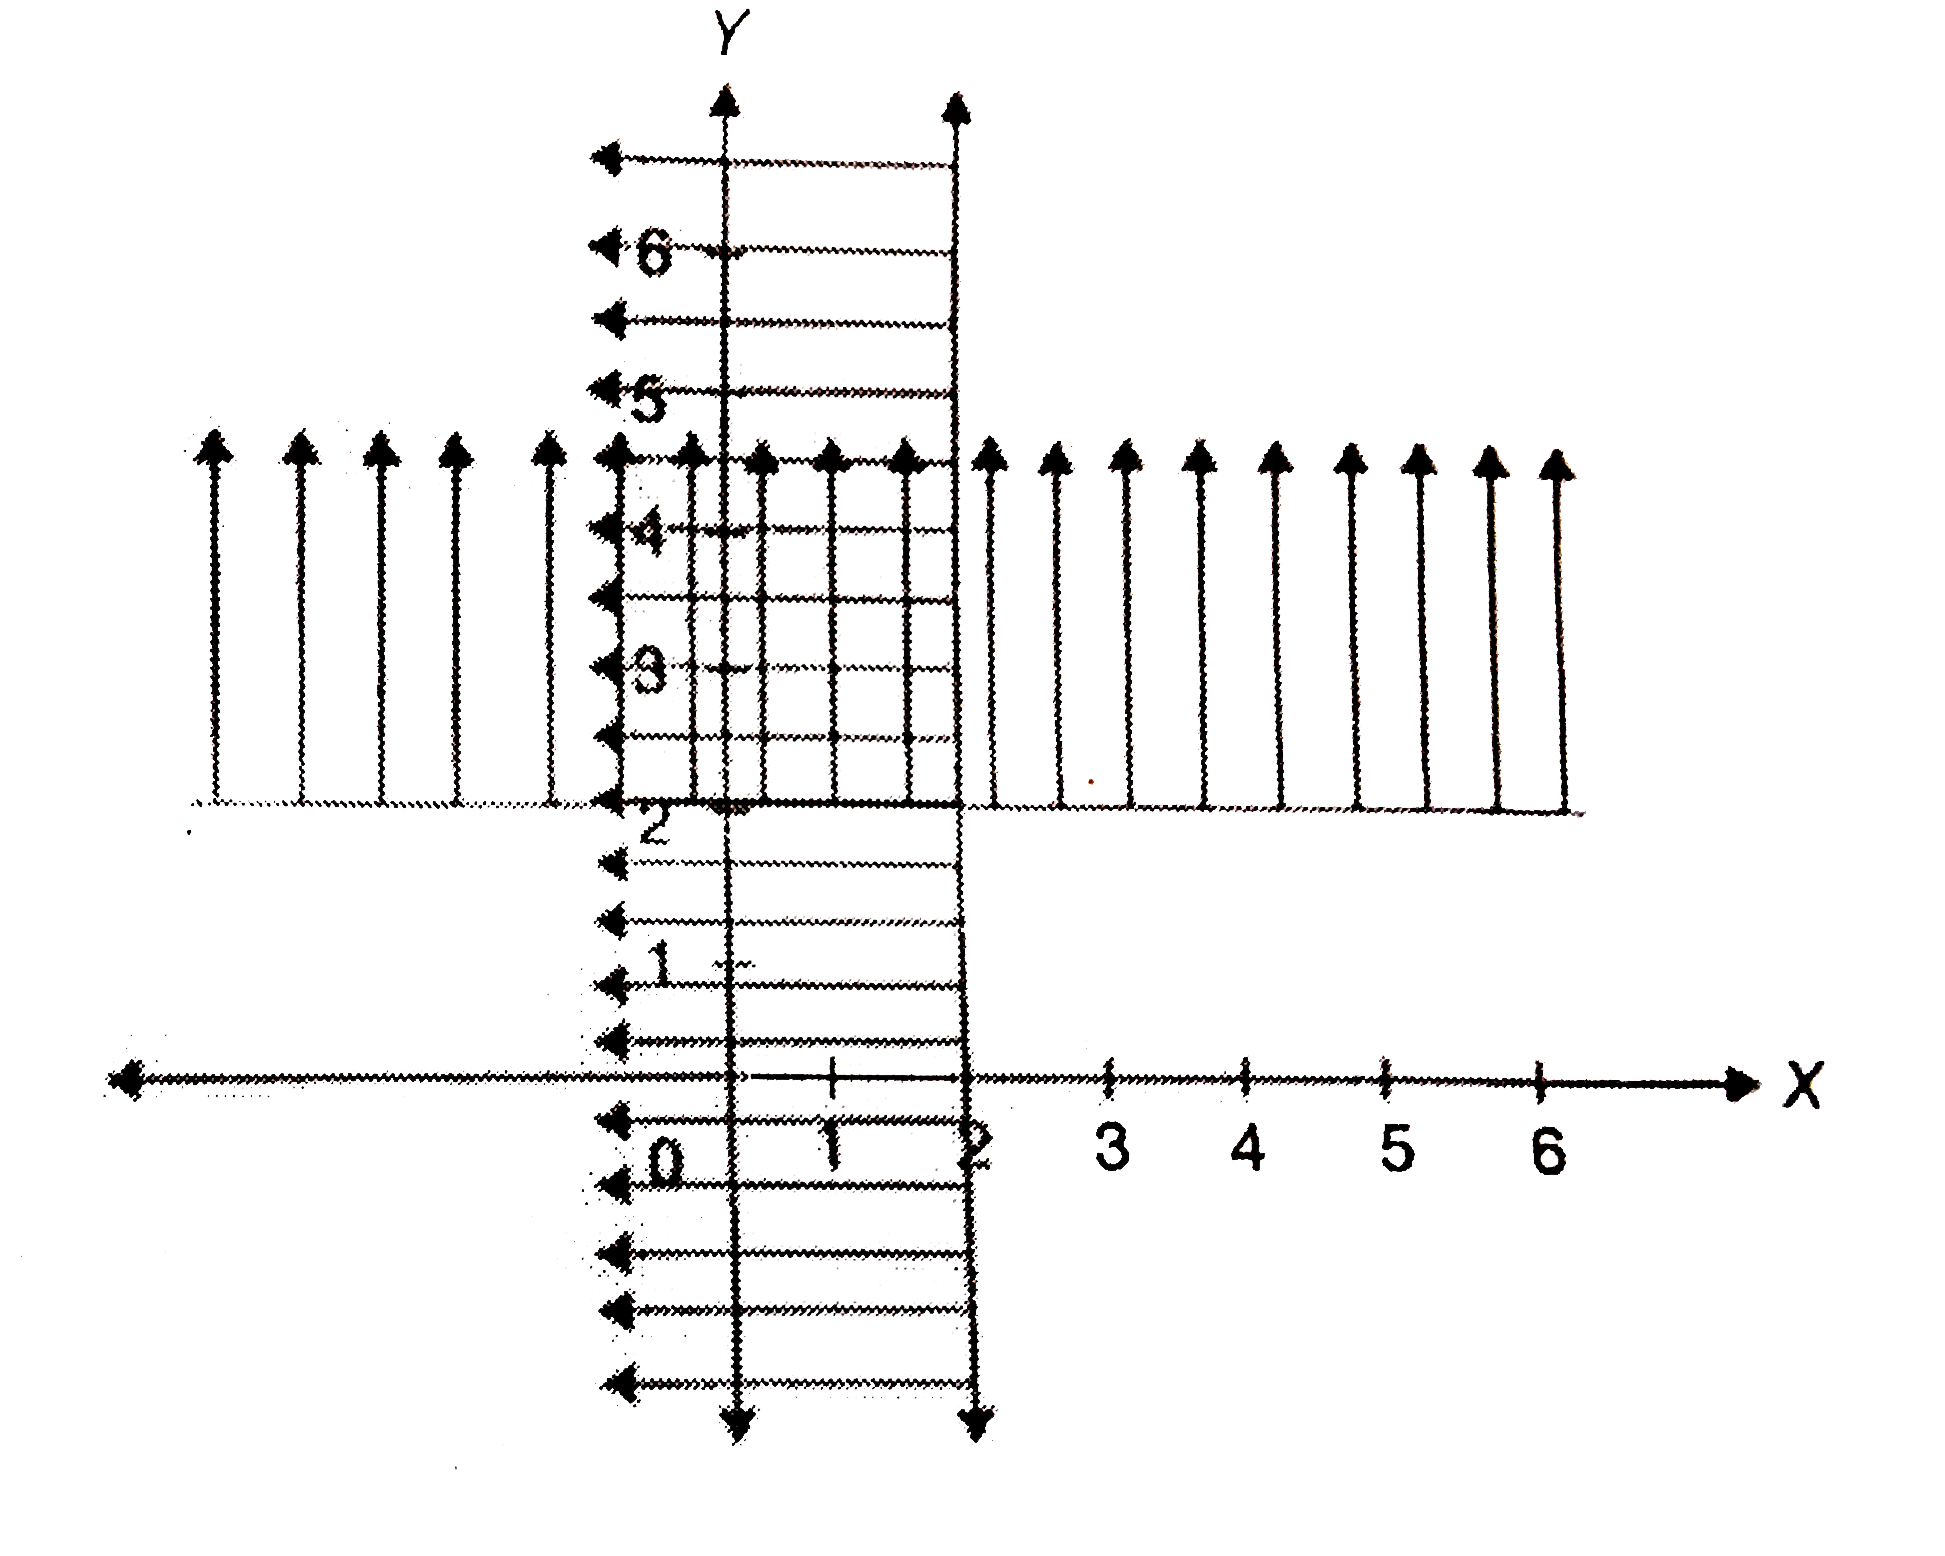
View SolutionThe shaded region in Figure is given by
View SolutionRepresent the shaded region in fraction form.
View Solution
