State True or False
To represent the population of different towns using bar graph, it is convenient to take one unit length to represent one person.
Step by step video & image solution for State True or False To represent the population of different towns using bar graph, it is convenient to take one unit length to represent one person. by Maths experts to help you in doubts & scoring excellent marks in Class 6 exams.
Updated on:21/07/2023Topper's Solved these Questions
- DATA HANDLINGBOOK - NCERT EXEMPLARCHAPTER - DATA HANDLINGEXERCISE - Exercise (fill in the blanks to make the statements true:)
1 Videos
- DATA HANDLINGBOOK - NCERT EXEMPLARCHAPTER - DATA HANDLINGEXERCISE - Exercise (fill in the blanks )
8 Videos
- DATA HANDLINGBOOK - NCERT EXEMPLARCHAPTER - DATA HANDLINGEXERCISE - Exercise (Write the correct answer.)
5 Videos
- ALGEBRA BOOK - NCERT EXEMPLARCHAPTER - ALGEBRA EXERCISE - EXERCISE
104 Videos
- FRACTIONS AND DECIMALS BOOK - NCERT EXEMPLARCHAPTER - FRACTIONS AND DECIMALS EXERCISE - ACTIVITY
1 Videos
Similar Questions
Knowledge Check
A bar graph is drawn to the scale 1 cm = k units, then a bar of length k cm represents
A1 unitBk unitsC2k unitsDk2 unitsTo achieve a reproductively healthy population different strategies are used, Which one is not true for the same from the given options?
Asex education in schoolsBprevention of sex abuseCresearch in reproductive health areaDreduction of marriageable ageA bar graph is drawn to the scale of 1 cm = 2m units. The length of the bar representing a quantity of 875 units is 1.75 cm. Find m.
A125B225C250D375
State True or False
In a bar graph, the width of bars may be unequal.
View SolutionState True or False
In a bar graph, the gap between two consecutive bars may not be the same.
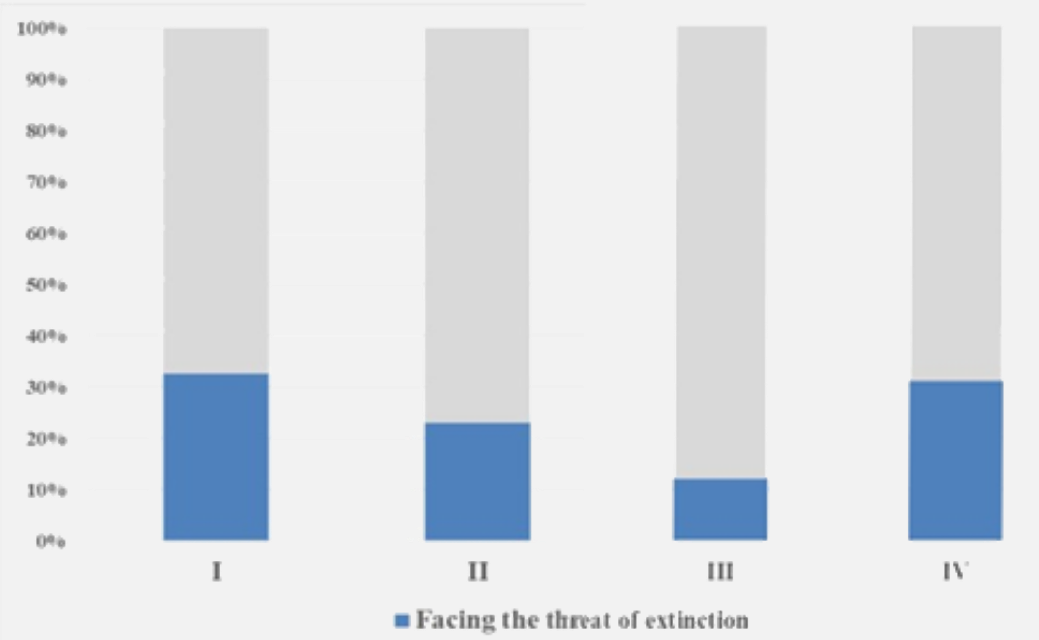
View SolutionObserve the following graph and state the correct animal or plant groups representing each bar.

View SolutionThe expenditure of a family of different heads in a month is given below

Draw a bar graph to represent the data above.
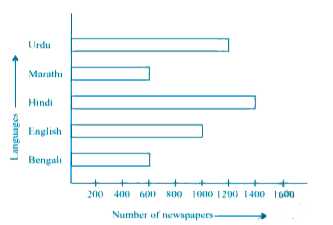
View SolutionThe bar graph given below represents the circulation of newspapers in different languages in a town. Study the bar graph and answer the following questions:

What is the circulation of English newspaper?
View Solution
