Study the graph given below and answer the questions that follow
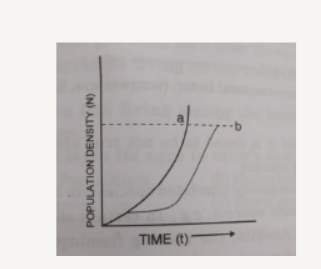
In the absence of predators, which one of the two curves would depict the prey population?Solution in Punjabi
Step by step video & image solution for Study the graph given below and answer the questions that follow In the absence of predators, which one of the two curves would depict the prey population? by Biology experts to help you in doubts & scoring excellent marks in Class 12 exams.
Updated on:21/07/2023Topper's Solved these Questions
- ORGANISMS AND ENVIRONMENTBOOK - MBDCHAPTER - ORGANISMS AND ENVIRONMENTEXERCISE - EXERCISE
13 Videos
- MOLECULAR BASIS OF INHERITANCEBOOK - MBDCHAPTER - MOLECULAR BASIS OF INHERITANCEEXERCISE - Exercise
20 Videos
- PRINCIPLES & PROCESSES IN BIOTECHNOLOGYBOOK - MBDCHAPTER - PRINCIPLES & PROCESSES IN BIOTECHNOLOGYEXERCISE - EXERCISE
14 Videos
Similar Questions
Whih of the following is a partial root parasite?
View SolutionTo initate translation, the mRNA first binds to :
View SolutionWho among the following was awarded the Nobel Prize for the development of PCR technique?
View SolutionStudy the graph given below and answer the questions that follow : (i) The curve 'b' is described by the following equation : (dN)/(dt) = rN {(K-N)/(K)} (ii) What does 'K' stand for in this equation ? Mention its significance. (ii) Which one of the two curves is considered a more realistic one for most of the animal populations ? (iii) Which curve would depict the population of a species of deer if there are no predators in the habitat ? Why is to so ?
View SolutionStudy the graph given below and answer the questions that follow: i) Write the status of food and space in the curves a) and b). ii) In the absence of predators, which one of the two curves would appropriately depict the prey population? iii) Time has been shown on X-axis and there is a parallel dotted line above it. Give the significance of this dotted line.
View SolutionStudy the food web given below and answer the questions that follow.
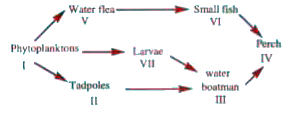
Which of the following organisms in the given food web act both as a predator and a prey?
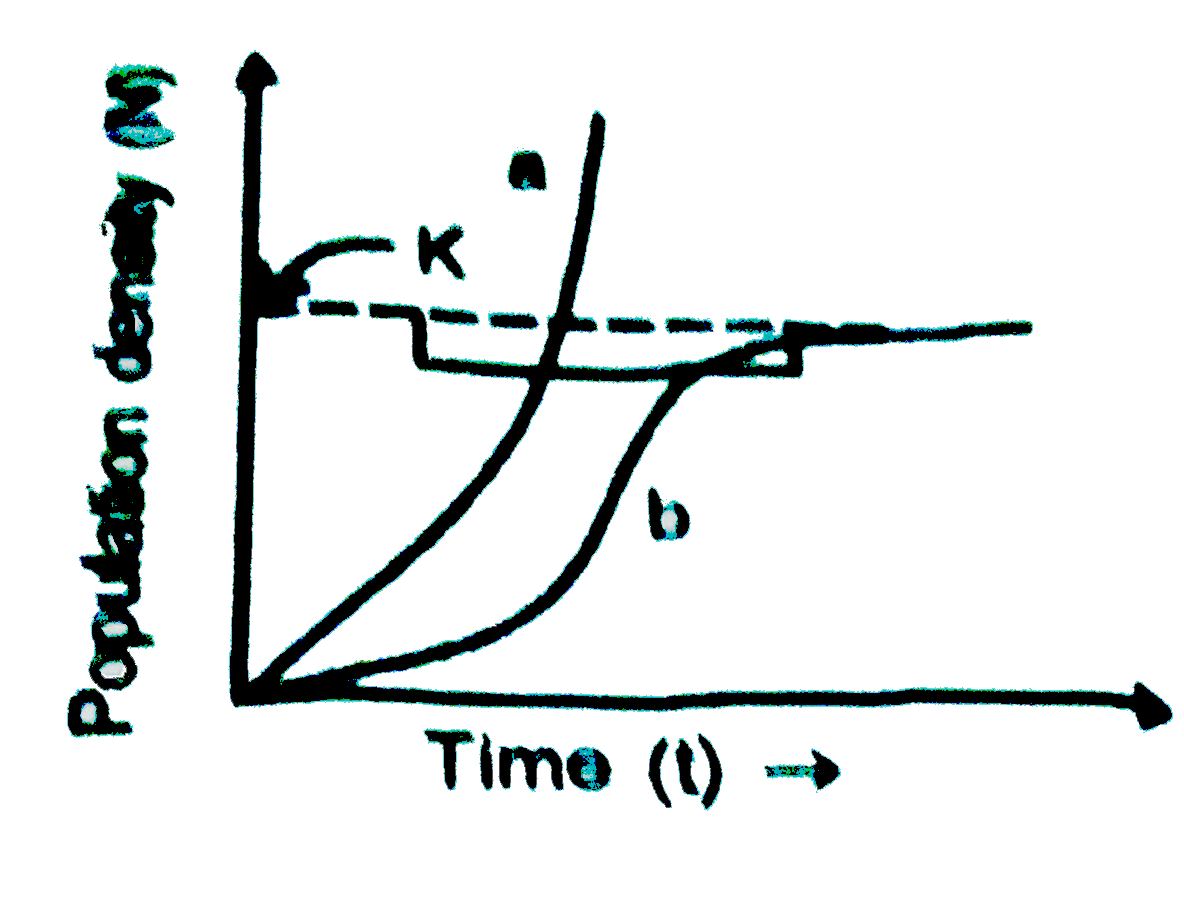
View SolutionStudy the graph given below and answer the questions that follow :
(i) The curve 'b' is described by the following equation :
dNdt=rN{K−NK}
(ii) What does 'K' stand for in this equation ? Mention its significance.
(ii) Which one of the two curves is considered a more realistic one for most of the animal populations ?
(iii) Which curve would depict the population of a species of deer if there are no predators in the habitat ? Why is to so ?
View SolutionStudy the graph given below and answer the questions that follow:
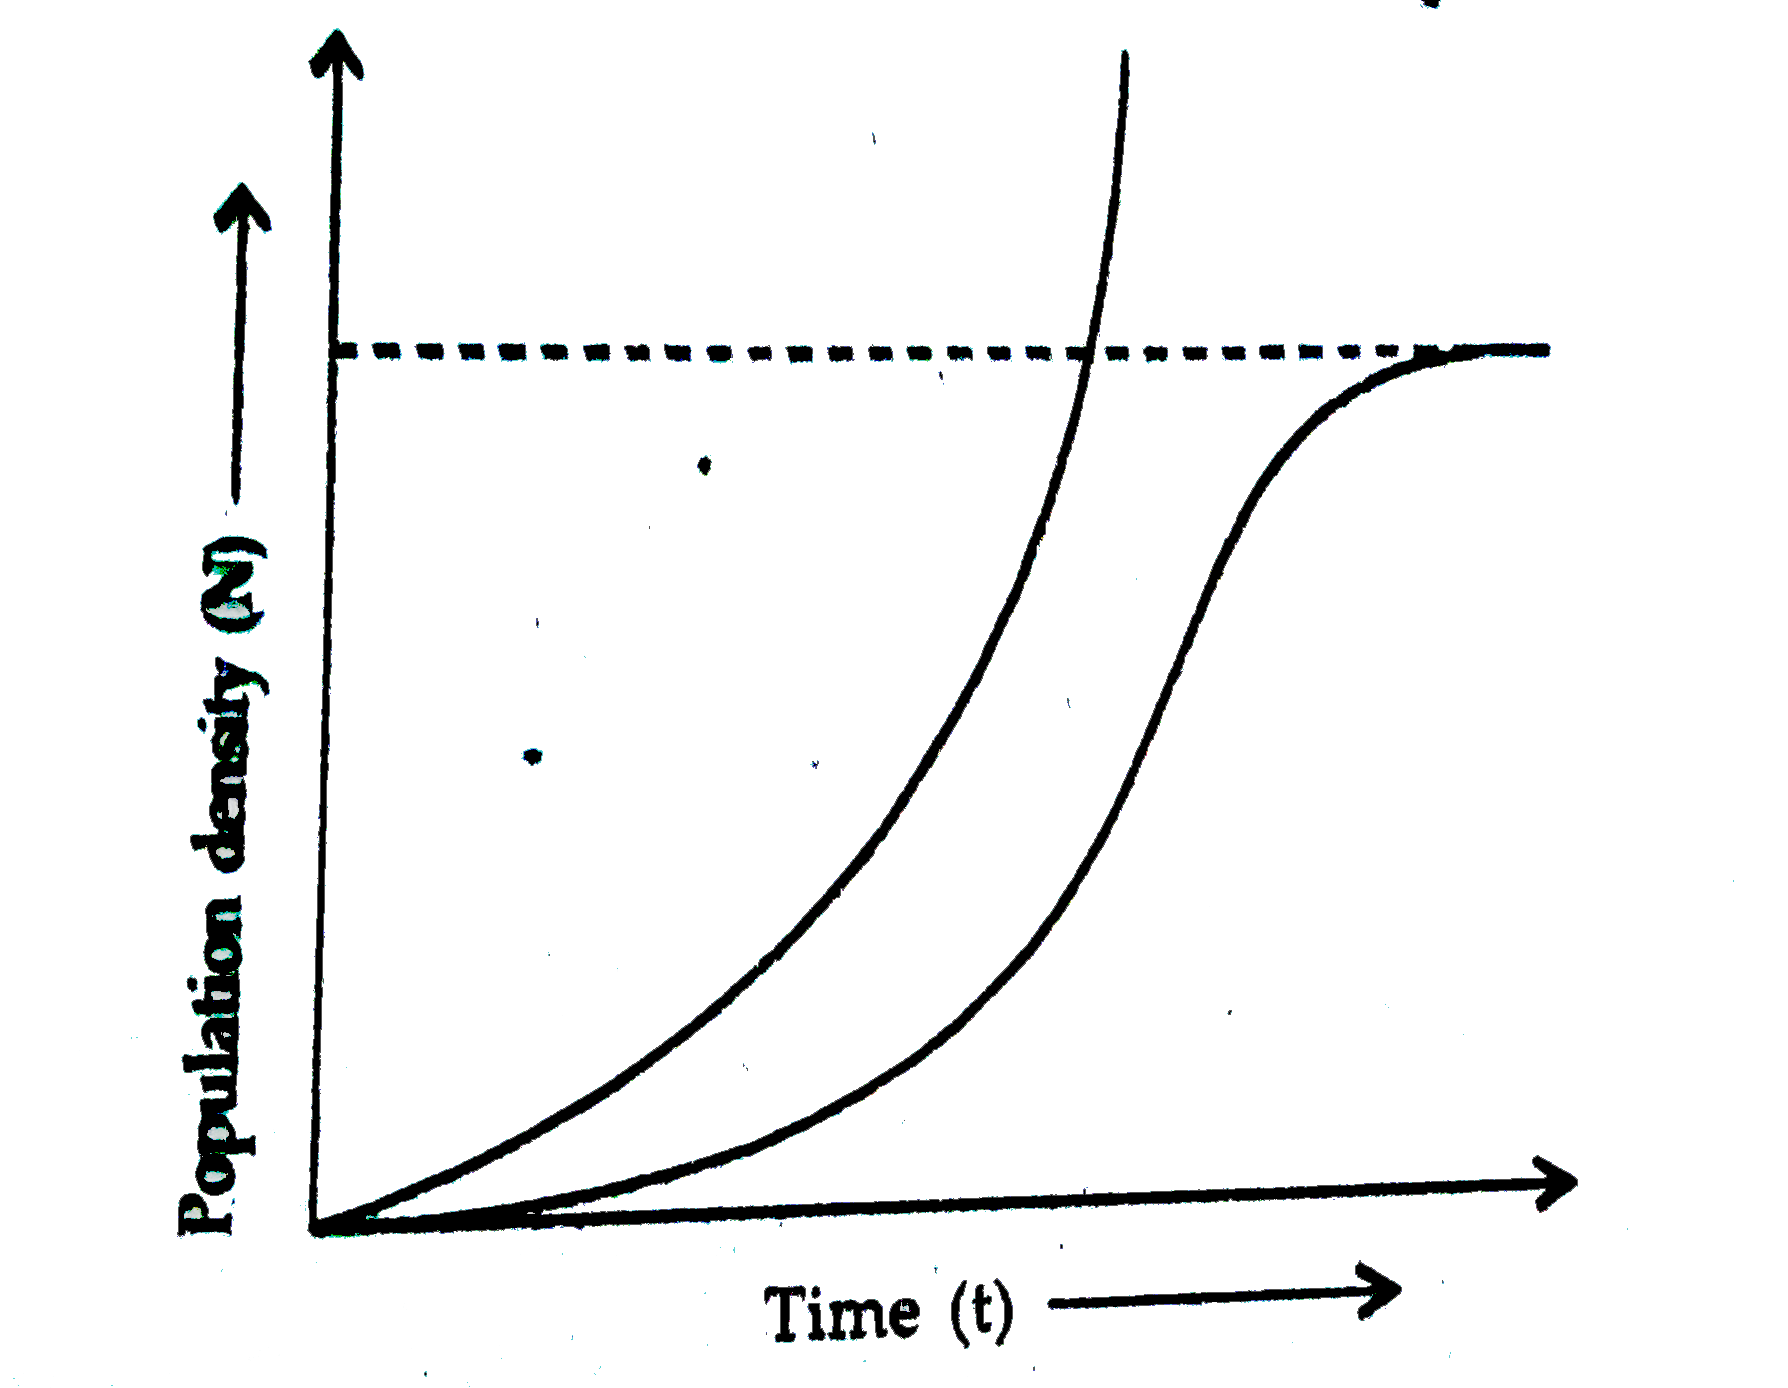
i) Write the status of food and space in the curves a) and b).
ii) In the absence of predators, which one of the two curves would appropriately depict the prey population?
iii) Time has been shown on X-axis and there is a parallel dotted line above it. Give the significance of this dotted line.
View SolutionIn the adjacent population growth curve:
In the absence of predators which curve a or b would appropriately depict the prey population?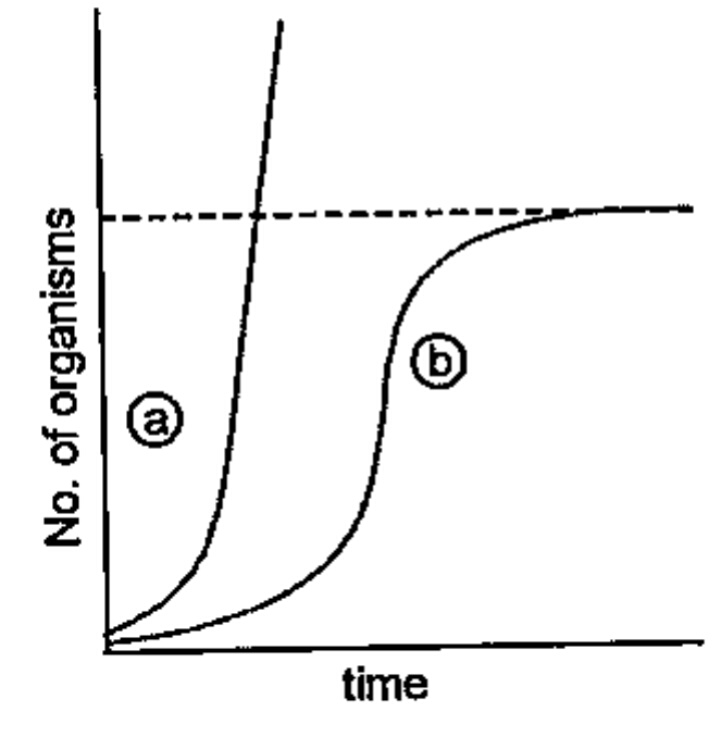
View SolutionStudy the figures (A) and (B) given below and answer the questions that follow:
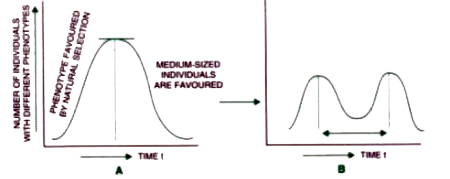
Under the influence of which type of Natural Selection would graph (A) become like graph (B)?
View SolutionPopulation growth curves (two types are given: observe the following graph answer the following questions.) Identify the curves a & b.
View SolutionPopulation growth curves (two types are given: observe the following graph answer the following questions.) Explain the significance og K.
View SolutionPopulation growth curves (two types are given: observe the following graph answer the following questions.) Which population growth has limited food supply?
View SolutionStudy the 3 representative figure of age pyramid relating to human population given below and answer the following question:

Which one of them is ideal for a population and why?
View SolutionStudy the graph given below and answer the questions that follow Write the status of food and space in the curves (a) and (b).
View Solution
