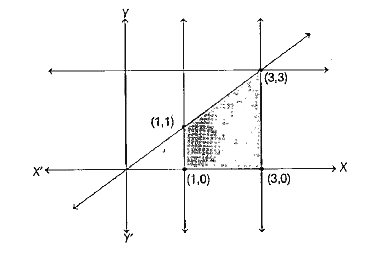
Find the minimum value of Z=2x+y in the following region.
 Solution in Odia
The correct Answer is:(i) Linear constraints are x + y ≤ 50, 3x + y ≤ 90, x ≥ 0 and y ≥ 0 and corner points are 0(0,0), A(30,0), B(20, 30) and C(0,50)..
(ii) Minimum value of Z is 2 at (1, 0).
Step by step video, text & image solution for Find the minimum value of Z=2x+y in the following region. by Maths experts to help you in doubts & scoring excellent marks in Class 12 exams.
Updated on:21/07/2023Topper's Solved these Questions
- LINEAR PROGRAMMINGBOOK - ARIHANT PUBLICATIONCHAPTER - LINEAR PROGRAMMINGEXERCISE - CHAPTER PRACTICE (Long Answer Type Questions 6 Marks)
18 Videos
- LINEAR PROGRAMMINGBOOK - ARIHANT PUBLICATIONCHAPTER - LINEAR PROGRAMMINGEXERCISE - ODISHA BUREAU.S TEXTBOOK SOLUTIONS (Exercise 3(b))
15 Videos
- INVERSE TRIGONOMETRIC FUNCTIONS BOOK - ARIHANT PUBLICATIONCHAPTER - INVERSE TRIGONOMETRIC FUNCTIONS EXERCISE - CHAPTER PRACTICE
35 Videos
- MATRICES BOOK - ARIHANT PUBLICATIONCHAPTER - MATRICES EXERCISE - CHAPTER PRACTICE (Very Short Answer Type Questions)
56 Videos
Similar Questions
Find the maximum and minimum value of 2x + y subjects to the constraints are
x+3y≥6,x−3y≤3,3x+4y≤24
−3x+2y≤6,5x+y≥5 and x,y≥0
View SolutionSolve the following LPPs graphically.
maximise Z=5x1+6x2
Subject to 2x1+3x2≤6
x1,x2≥0
View SolutionEvaluate cot−1(−√3).
View SolutionWhat possible orders of a matrix can have , if it has
(i) 5 elements ?
(ii) 8 elements ?
View SolutionWhich of the following are correct chain isomers of butane ? (i)
View SolutionDetermine the point of symmetry of a regular hexagon.
View SolutionDtermine the images of the following figure about the given line :
View SolutionMatch the following Column A to Column B

View SolutionMatch the following Column A to Column B

View SolutionMatch the following Column A to Column B

View SolutionFind the area of figure given below.

View SolutionFind the area of the figure given below.

View SolutionThe inequation represented by the graph given below is :
View SolutionThe inequation that best describes the graph given below is _________
View SolutionThe inequation that best describes the following graph is _________
View SolutionWhich inequations represent the shaded region in the given figure
View Solution
