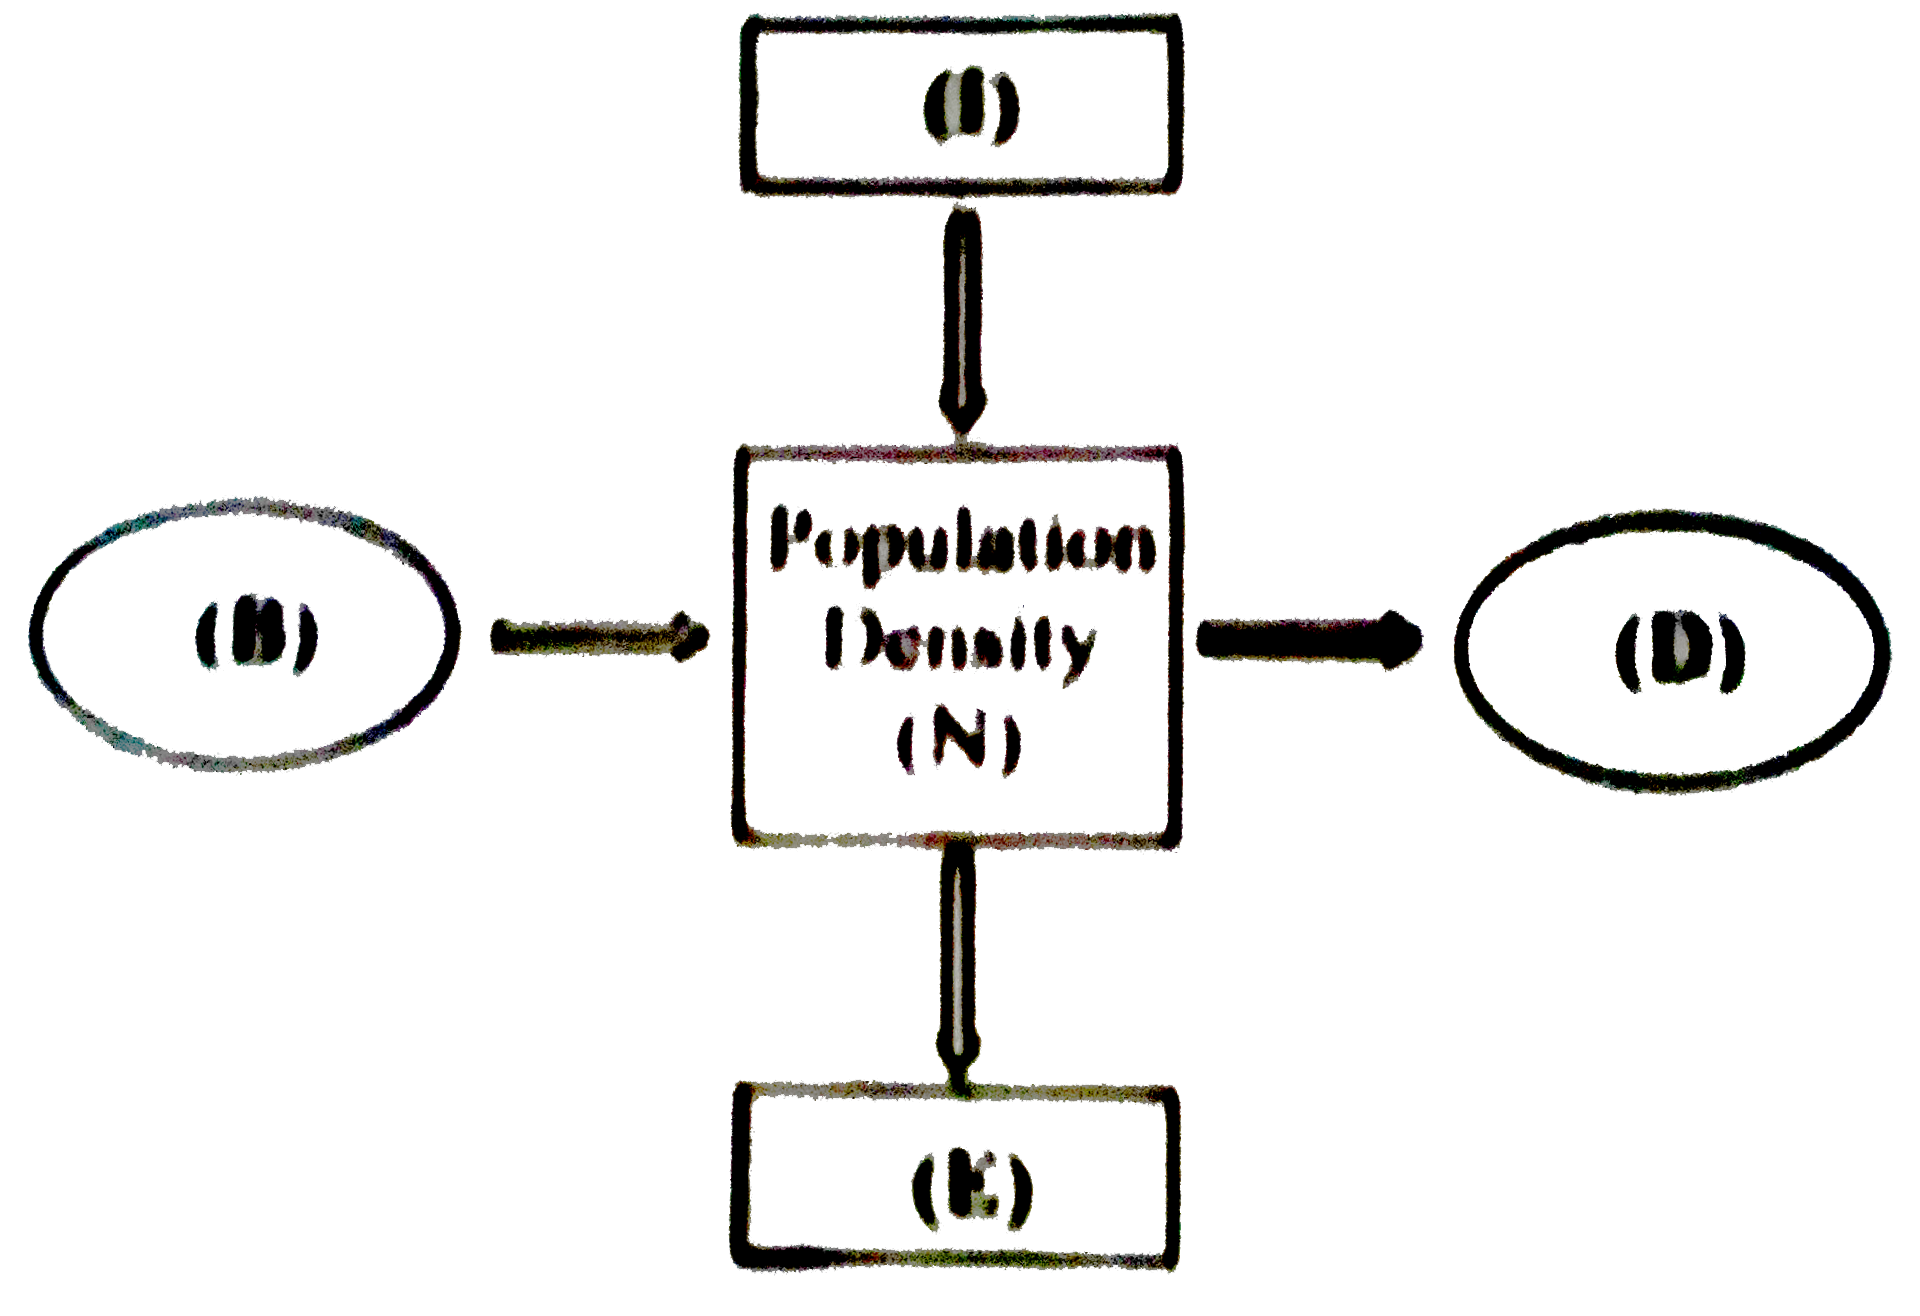
A biologist studied the population of rats in a barn. He found that the average natality was 250, average mortality 240, immigration 20 and emigration 30. The net increase in population is
5
Zero
10
15
The correct Answer is:B
Nt+1=Nt[(B+1)−(D+E)]
Nt+1=Nt+[(250+20)−(240+30)]
Nt+1=Nt
As there is Nt+1=Nt so change in population size is zero.
Similar Questions
A biologist studied the population of rats in a barn. He found that the average natality was 250, average mortality 240, immigration 20 and emigration 30. The net increase in populations is :
View SolutionA biologist studied the population of rats in a barn. He found that the average natality was 250, average mortality 240, immigration 20 and emigration 30. The net increase in populations is :
View Solution
Knowledge Check
A biologist studied the population of rats in a barn. He found that the average natality was 250, average mortality 240, immigration 20 and emigration 30. The net increase in populations is :
A15B5C10DzeroA biologist studied the population of rats in a barn. He found that the average natalty was 250, average mortality 240, immigration 20 and emigration 30. The net increase in populations is:
A5BZeroC10D15A biologist studied the population of rats in a barn. He found that the average natality was 250, average mortality 240, immigration 20 and emigration 30. The net increase in populations is :
A5BzeroC10D15
On investigation, the following data was obtained regarding population of rats in a barn:
Average natality =500 per year,
Average mortality = 480 per year,
Immigration = 25 per year,
Emigration = 45 per year
Indicate whether the population is increasing or decreasing? If at the start of investigation there were 100 rats, how many would there be at the end of ten years?
View SolutionThe given figure represents different factors affecting population density (N). If B= natality D= mortality ,E=emigration and I= immigration, then select the incorrect option regarding these.

View SolutionThe given figure represents different factors affecting population density (N). If B= natality D= mortality ,E=emigration and I= immigration, then select the incorrect option regarding these.

View SolutionWhich of the following contributes to increase in population density ?
(a) Natality
(b) Mortality
(c) Immigration
(d) Emigration
View SolutionThe given figure represents different factors affecting population density (N). If B= natality D= mortality ,E=emigration and I= immigration, then select the incorrect option regarding these.

View Solution
