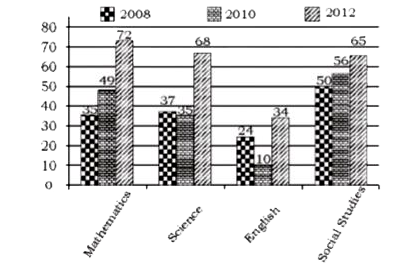
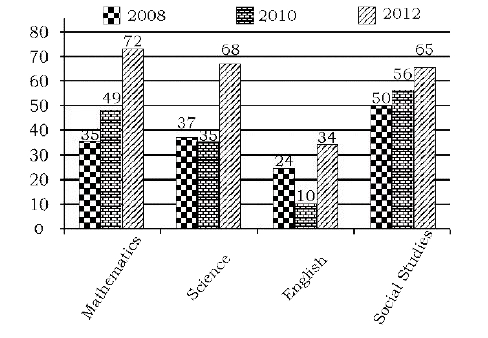
The given bar graph shows the number of marks scored by a student in each subject in three years.
दिया गया दंड आरेख एक छात्र के द्वारा तीन वर्षो में प्रत्येक विषय में लाये गए अंकों को दर्शाता है |
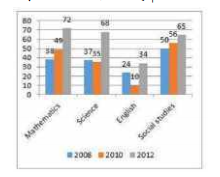 In the given chart, what is the percentage increase in marks in Mathematics in 2012 compared to 2008 (round off) ? /
इस आरेख में वर्ष 2008 की तुलना में वर्ष 2012 में गणित के अंकों में कितने प्रतिशत की वृद्धि हुई है ?
95
92
100
89
Step by step video & image solution for The given bar graph shows the number of marks scored by a student in each subject in three years. दिया गया दंड आरेख एक छात्र के द्वारा तीन वर्षो में प्रत्येक विषय में लाये गए अंकों को दर्शाता है | In the given chart, what is the percentage increase in marks in Mathematics in 2012 compared to 2008 (round off) ? / इस आरेख में वर्ष 2008 की तुलना में वर्ष 2012 में गणित के अंकों में कितने प्रतिशत की वृद्धि हुई है ? by Maths experts to help you in doubts & scoring excellent marks in Class 14 exams.
Updated on:21/07/2023Topper's Solved these Questions
Similar Questions
The given bar graph shows the number of marks scored by a student in each subject in three years.
दिया गया दंड आरेख एक छात्र के द्वारा तीन वर्षो में प्रत्येक विषय में लाये गए अंकों को दर्शाता है |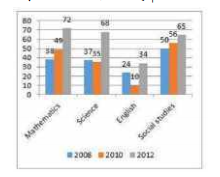 In the given chart, in which subject was the lowest marks scored in 2010?
इस दंड आरेख के अनुसार वर्ष 2010 में किस विषय में सबसे कम अंक आये थे?
View SolutionThe given bar graph shows the number of marks scored by a student in each subject in three years.
दिया गया दंड आरेख एक छात्र के द्वारा तीन वर्षो में प्रत्येक विषय में लाये गए अंकों को दर्शाता है |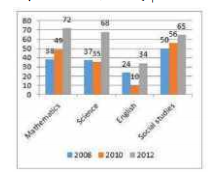 In the given chart, the number of marks in social studies in 2012 is 13% of the school strength. The number of students is:
दिए गए चार्ट में, यदि वर्ष 2012 में सामाजिक अध्ययन में अंकों की संख्या स्कूल की के छात्रों की संख्या का 13% है। छात्रों की संख्या कितनी है?
View SolutionThe given bar chart shows number of marks scored by a student in each subject in three years:
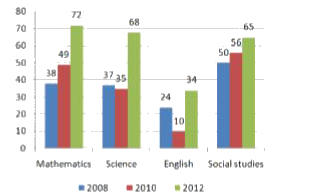
In the given bar-chart. what is the percentage increase in marks in Mathematics in 2012 compared to 2008?(round off)
View SolutionThe given bar chart shows number of marks scored by a student in each subject in three years
In the given bar chart, in which subject was the lowest marks scored in 2010
View SolutionThe given pie chart shows runs scored by A in 6 matches.
दिया गया पाई चार्ट A के द्वारा 6 मैचों में बनाए गए रनों को दर्शाता है |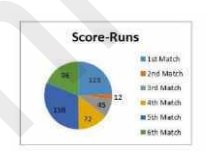 In the given pie-chart, what is the increase or decrease in score in match 4 as compared to match 2?
/ इस पाई चार्ट में मैच 2 की तुलना में मैच 4 के स्कोर में कितनी वृद्धि या कमी हुई है ?
View SolutionThe given Bar Graph presents the number of students of two schools for six years.
दिया गया दंड आरेख (बार ग्राफ) छह वर्षो के दौरान दो स्कूलों में विद्यार्थियों की संख्या को दर्शाता है|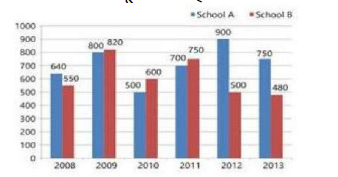 In which year, the percentage increase in students in school B is the highest in comparison to its previous year?
किस वर्ष में, स्कूल B के विद्यार्थियों की संख्या में प्रतिशत वृद्धि इसके पिछले वर्ष की तुलना में सबसे अधिक है?
View SolutionThe given Bar Graph presents the number of students of two schools for six years.
दिया गया दंड आरेख छः वर्ष की अवधि में दो विद्यालयों में छात्रों की संख्या को दर्शाता है | In which year, the percentage increase in students in school B is the highest in comparison to its
previous year?
किस वर्ष में, विद्यालय B में छात्रों की संख्या में प्रतिशत वृद्धि इसके पिछले वर्ष की तुलना में सबसे अधिक रही है?
View SolutionThe given Bar Graph presents the number of students of two schools for six years.
दिया गया दंड आरेख छः वर्ष की अवधि में दो विद्यालयों में छात्रों की संख्या को दर्शाता है |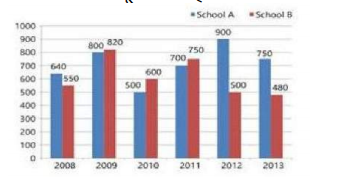
In which year, the percentage increase of students in school A is the highest in comparison to its previous year?
किस वर्ष, विद्यालय A में छात्रों की संख्या में प्रतिशत वृद्धि पिछले वर्ष की तुलना में सर्वाधिक है ?
View SolutionThe given bar chart shows number of marks scored by a student in each subject in three years
In the given bar chart what is the approximate percentage increase in marks in mathematics in 2012 compared to 2008?
View SolutionThe given Bar Graph presents the number of students of two schools for six years.
दिया गया दंड आरेख (बार ग्राफ) छह वर्षो के दौरान दो स्कूलों में विद्यार्थियों की संख्या को दर्शाता है|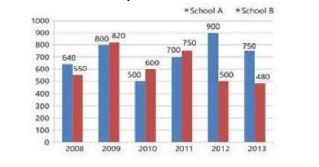 In which year, percentage increase of students in school A is the highest in comparison to its previous year ?
किस वर्ष में, स्कूल A की विद्याथियों की संख्या में प्रतिशत वृद्धि इसके पिछले वर्ष की तुलना में सबसे अधिक है?
View Solution