Study the following bar graph and answer the question given.
निम्नलिखित दंड आरेख का अध्ययन करें तथा दिए गए प्रश्न का उत्तर दें |
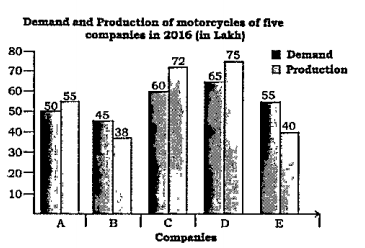 The number of companies whose production of motorcycles is equal to or more than the average demand of motorcycles (per year) over five years is:
ऐसी कंपनियों की संख्या कितनी है जिसका मोटरसाइकिल उत्पादन इन पांच वर्षों के दौरान मोटरसाइकिलों की औसत मांग (प्रति वर्ष ) से अधिक या बराबर रहा है ?
4
2
1
3
Step by step video & image solution for Study the following bar graph and answer the question given. निम्नलिखित दंड आरेख का अध्ययन करें तथा दिए गए प्रश्न का उत्तर दें | The number of companies whose production of motorcycles is equal to or more than the average demand of motorcycles (per year) over five years is: ऐसी कंपनियों की संख्या कितनी है जिसका मोटरसाइकिल उत्पादन इन पांच वर्षों के दौरान मोटरसाइकिलों की औसत मांग (प्रति वर्ष ) से अधिक या बराबर रहा है ? by Maths experts to help you in doubts & scoring excellent marks in Class 14 exams.
Updated on:21/07/2023Topper's Solved these Questions
Similar Questions
Study the following bar graph and answer the question given.
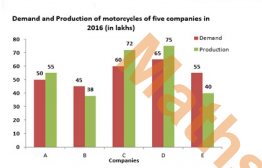 The number of companies whose production of motorcycles is equal to or more than the average demand of motorcycles (per year) over five years is:
View SolutionStudy the following bar graph and answer the question given.
निम्नलिखित दंड आरेख का अध्ययन करें तथा दिए गए प्रश्न का उत्तर दें |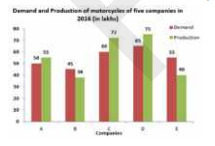 The total production of motorcycles of companies C, D and E is what percent less than the total demand of motorcycles of all the companies during five years?
कंपनी C, D और E की मोटरसाइकिल का कुल उत्पादन पांच वर्षों के दौरान सभी कंपनियों की मोटरसाइकिलों की कुल मांग से कितना प्रतिशत कम है ?
View Solution
Knowledge Check
Study the following bar graph and answer the question given
निम्नलिखित दंड-आरेख (बार-ग्राफ) का अध्ययन कीजिए तथा दिए गए प्रश्न का उत्तर दीजिए: The number of companies whose production of motorcycles in equal to or more than the average demand of motorcycles (per year) over five years is:
उन कंपनियों की संख्या बताइए,जिनके द्वारा मोटरसाइकिलों का उत्पादन, पांच वर्षों में मोटरसाइकिलों की औसत मांग (प्रति वर्ष) के बराबर या अधिक है?A4B2C1D3Study the following bar diagram carefully and answer the following questions :
निम्नलिखित आरेख का ध्यानपूर्वक अध्ययन करें और दिए गए प्रश्नों का उत्तर दें:
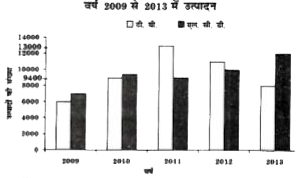
The ratio of production of TVs in the years 2009 and 2010 is.
वर्ष 2009 और 2010 में टी. वी. के उत्पादन का अनुपात -A(a)7:6B(b) 2:3C(c) 6:7D(d) 3:2Study the following bar diagram carefully and answer the following questions :
:
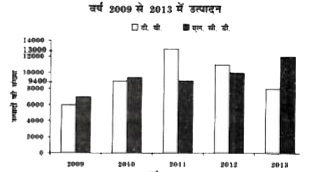
The total number of a products of electronic items is maximum in the year.A(a) 2010B(b) 2009C(c) 2011D(d) 2013
Study the following bar graph and answer the question given
 .
The The The The numbers of companies whose production of motorcycles in equal to or more than the average demand of motorcycles (per year) over five years is:
View SolutionStudy the following bar graph and answer the question given.
निम्नलिखित दंड आरेख का अध्ययन करें तथा दिए गए प्रश्न का उत्तर दें |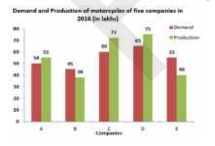 The ratio of the total demand of motorcycles of companies A, C and E to the total production of
motorcycles of B and C is:
कंपनी A, C और E की मोटरसाइकिल की कुल मांग और B तथा C की मोटरसाइकिल के कुल उत्पादन के बीच अनुपात ज्ञात करें
View SolutionStudy the following bar graph and answer the question given.
निम्नलिखित दंड-आरेख (बार-ग्राफ) का अध्ययन कीजिए तथा दिए गए प्रश्न का उत्तर दीजिए: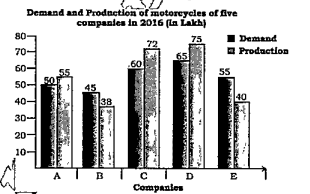 The total production of
motorcycles of companies C, D and E is what per cent less than the total demand of motorcycles of all the companies during five
years?
कंपनी C,D और E के द्वारा मोटरसाइकिलों का कुल उत्पादन, पांच वर्षों के दौरान सभी कंपनियों की मोटरसाइकिलों की कुल मांग से कितने ग्रतिशत कम है?
View SolutionStudy the following bar graph and answer the question given
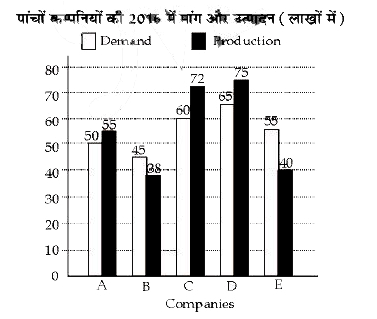
The ratio of the total demand of motorcycles of companies A,C and E to the total production of motorcycles of B and C is:
View SolutionStudy the following bar diagram carefully and answer the following questions :
निम्नलिखित आरेख का ध्यानपूर्वक अध्ययन करें और दिए गए प्रश्नों का उत्तर दें:
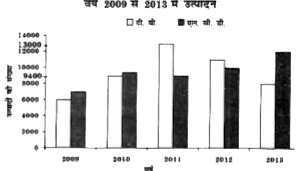
The ratio of production of LCDs in the year 2011 and 2013 is.
वर्ष 2011 और 2013 में एल. सी. डी. के उत्पादन का अनुपात है
View Solution