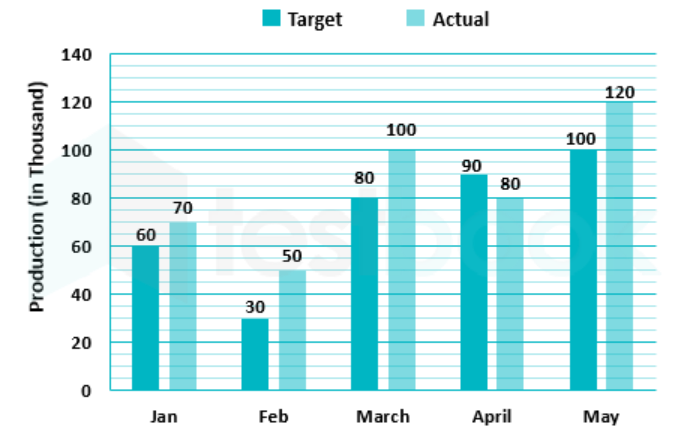
The given Bar Graph presents the Target and Actual production of AC Machines (numbers in thousands) of a factory over five months.
दिया गया दंड आरेख पांच महीनों के दौरान एक फैक्ट्री में एसी मशीनों के उत्पादन का लक्ष्य तथा वास्तविक उत्पाद को दर्शाता है |
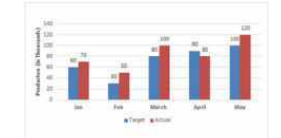 The ratio of the combined target production of AC Machines in January and April to that of the combined actual production of AC Machines in March and April was:
जनवरी और अप्रेल में एसी मशीनों के उत्पादन के संयुक्त लक्ष्य तथा मार्च और अप्रैल में एसी मशीनों के वास्तविक संयुक्त उत्पादन में क्या अनुपात है ?
4:5
3:2
5:6
2:3
Step by step video & image solution for The given Bar Graph presents the Target and Actual production of AC Machines (numbers in thousands) of a factory over five months. दिया गया दंड आरेख पांच महीनों के दौरान एक फैक्ट्री में एसी मशीनों के उत्पादन का लक्ष्य तथा वास्तविक उत्पाद को दर्शाता है | The ratio of the combined target production of AC Machines in January and April to that of the combined actual production of AC Machines in March and April was: जनवरी और अप्रेल में एसी मशीनों के उत्पादन के संयुक्त लक्ष्य तथा मार्च और अप्रैल में एसी मशीनों के वास्तविक संयुक्त उत्पादन में क्या अनुपात है ? by Maths experts to help you in doubts & scoring excellent marks in Class 14 exams.
Updated on:21/07/2023Topper's Solved these Questions
Similar Questions
The given Bar Graph presents the Target and Actual production of AC Machines (numbers in thousands) of a factory over five months.
दिया गया दंड आरेख पांच महीनों के दौरान एक फैक्ट्री में एसी मशीनों के उत्पादन का लक्ष्य तथा वास्तविक उत्पाद को दर्शाता है |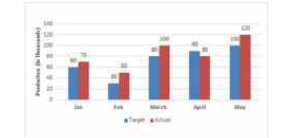
The total target production of AC Machines in February, April and May was what percentage less than the total actual production of AC Machines over all the five months (correct to one decimal place)?
फरवरी, अप्रैल और मई में एसी मशीनों के कुल उत्पादन का लक्ष्य इन पांच महीनों में एसी मशीनों के कुल वास्तविक उत्पादन से कितना प्रतिशत कम है ? ( एक दशमलव स्थान तक सही )
View SolutionThe given Bar graph presents the Demand and Production of motorcycles of five companies (in lakhs)
दिया गया दंड आरेख पांच कंपनियों के संबंध में मोटरसाइकिलों की मांग और उत्पादन ( लाख में ) को दर्शाता है|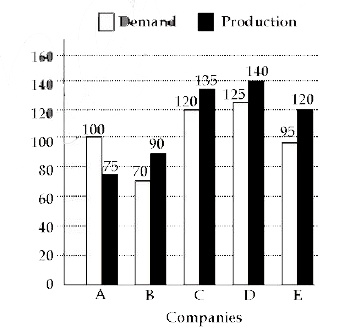 What is the ratio of the total Demand of motorcycles of companies A and D taken together to the Production of motorcycles of company C?
कंपनी A और D को मिलाकर मोटरसाइकिलों की कुल मांग का कंपनी C की मोटरसाइकिलों के उत्पादन के साथ अनुपात ज्ञात करें |
View Solution
Knowledge Check
The given bar graph presents the target and actual production of AC machines of a factory over five months
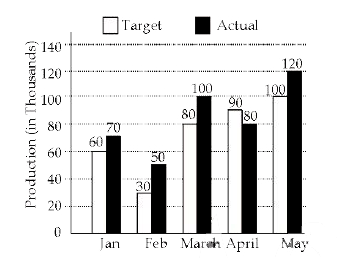
The ratio of the combined target production of AC machines in January and April to that of the combined actual production of AC Machines in March and April wasA4:5B3:2C5:6D2:3The total target production of AC machines in February, April and May was what percentage less than the total actual production of Ac Machines over all the five months.
A0.462B0.468C0.471D0.476In which month the actual production of AC machines was 25% more than the target production?
 AFebruaryBMarchCJanuaryDMay
The given Bar graph presents the Demand and Production of motorcycles of five companies (in lakhs)
दिया गया दंड आरेख पांच कंपनियों के संबंध में मोटरसाइकिलों की मांग और उत्पादन ( लाख में ) को दर्शाता है|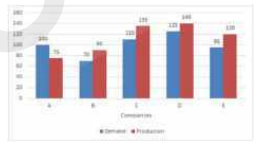 The company in which the Production of motorcycles is approximately 23% more than the
Demand is:
वह कंपनी जिसमें मोटरसाइकिलों का उत्पादन, मांग से लगभग 23% अधिक है :
View SolutionThe table given below presents the figures of the production (in thousands) of different types of vehicles by a company during the year 2013-18.
नीचे दी गयी तालिका वर्ष 2013-18 के दौरान एक कंपनी के द्वारा विभिन्न प्रकार के वाहनों के उत्पादन ( हज़ार में)के आंकड़ों को प्रस्तुत करती है |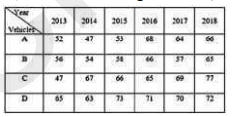 The ratio of the total production of type A vehicles in 2013 and 2016 to the total production of type C vehicles during 2015 to 2017 is:
2013 तथा 2016 में A प्रकार के वाहनों के कुल उत्पादन एवं 2015 से 2017 के दौरान C प्रकार के वाहनों के कुल उत्पादन में अनुपात ज्ञात करें |
View SolutionThe given bar graph represents the income and expenditure of a person during the four consecutive months, April to July, 2019.
दिया गया दंड आरेख , लगातार चार महीनों, अप्रेल से जुलाई, 2019 के दौरान किसी व्यक्ति की आय और व्यय को प्रदर्शित करता है। What is the average income of the person?
व्यक्ति की औसत आय कया है?
View SolutionThe given Bar graph presents the Demand and Production of motorcycles of five companies (in lakhs)
दिया गया दंड आरेख पांच कंपनियों के संबंध में मोटरसाइकिलों की मांग और उत्पादन ( लाख में ) को दर्शाता है|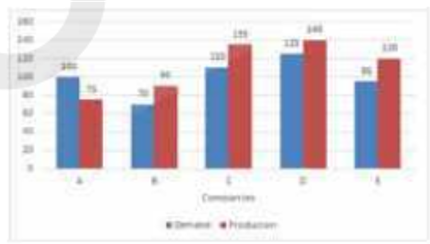 The average Production of motorcycles of companies B, C and E taken together is what percent less than the Demand of motorcycles of D?
कंपनी B, C और E को मिलाकर मोटरसाइकिलों का औसत उत्पादन D की मोटरसाइकिलों की मांग से कितना प्रतिशत कम है ?
View SolutionThe actual production of Ac machines in April was that percentage more than the average target production of AC machines over five months?
View Solution
