The table given below presents the figures of the production (in thousands) of different types of vehicles by a company during the year 2013-18.
नीचे दी गयी तालिका वर्ष 2013-18 के दौरान एक कंपनी के द्वारा विभिन्न प्रकार के वाहनों के उत्पादन ( हज़ार
में)के आंकड़ों को प्रस्तुत करती है |
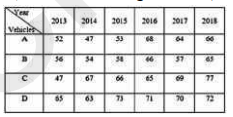 In how many years is the production of type C vehicles, below the average production of type D vehicles over six years?
कितने वर्ष C प्रकार के वाहनों का उत्पादन इन छः वर्षों में D प्रकार के वाहनों के औसत उत्पादन से कम रहा है ?
2
3
5
4
Step by step video & image solution for The table given below presents the figures of the production (in thousands) of different types of vehicles by a company during the year 2013-18. नीचे दी गयी तालिका वर्ष 2013-18 के दौरान एक कंपनी के द्वारा विभिन्न प्रकार के वाहनों के उत्पादन ( हज़ार में)के आंकड़ों को प्रस्तुत करती है | In how many years is the production of type C vehicles, below the average production of type D vehicles over six years? कितने वर्ष C प्रकार के वाहनों का उत्पादन इन छः वर्षों में D प्रकार के वाहनों के औसत उत्पादन से कम रहा है ? by Maths experts to help you in doubts & scoring excellent marks in Class 14 exams.
Updated on:21/07/2023Topper's Solved these Questions
Similar Questions
The graphs of the equations 3x+y-5=0 and 2x-y-5=0 intersect at the point P(α,β). What is the value of (3α+β) ?
समीकरण 3x+y-5=0 तथा 2x-y-5=0 के आरेख एक बिंदु P(α,β) पर एक-दूसरे को काटते है (3α+β) का मान क्या है ?
View SolutionAfter giving two successive discounts, each of x%, on the marked price of an article, total discount is Rs. 259.20. If the marked price of the article is Rs. 720, then the value of x is :
View SolutionThe table shows the production of different types of cars (in thousands). यह तालिका अलग-अलग प्रकार के कारों का उत्पादन ( हज़ार में) दर्शाती है | If the data related to the production of cars of type E is represented by a pie chart, then the central angle of the sector representing the data of production of cars in 2013 will be: यदि E प्रकार की कारों के उत्पादन से संबंधित आंकड़ों को एक पाई-चार्ट के द्वारा प्रदर्शित किया जाए, तो 2013 में कारों के उत्पादन के आंकड़ों को दर्शाने वाले खंड का केंद्रीय कोण होगा :
View SolutionThe table shows the production of different types of cars (in thousands). यह तालिका अलग-अलग प्रकार के कारों का उत्पादन ( हज़ार में) दर्शाती है | What is the ratio of the total production of cars of type A in 2014 and type C in 2013 taken together to the total production of cars of type B in 2016 and type E in 2015 taken together? 2014 में A प्रकार की कारों और 2013 में C प्रकार की कारों के कु ल उत्पादन का 2016 में B प्रकार की कारों और 2015 में E प्रकार की कारों के कुल उत्पादन के साथ अनुपात ज्ञात करें |
View SolutionThe table shows the production of different types of cars (in thousands). यह तालिका अलग-अलग प्रकार के कारों का उत्पादन ( हज़ार में) दर्शाती है | The number of years, in which the production of cars of type B is less than the average production of type D cars over the years is: कितने वर्ष B प्रकार की कारों का उत्पादन इन वर्षों के दौरान D प्रकार की कारों के औसत उत्पादन से कम रहा है ?
View SolutionThe table shows the production of different types of cars (in thousands)
यह तालिका अलग-अलग प्रकार के कारों का उत्पादन ( हज़ार में ) दर्शाती है |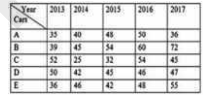 The production of cars of type A in 2015 and of type C in 2013 taken together is approximately what percent of the total production of cars of type D in five years?
2015 में A प्रकार की कारों का उत्पादन तथा 2013 में C प्रकार की कारों के उत्पादन को मिला दिया जाए, तो ये पांच वर्षों में D प्रकार की कारों के कुल उत्पादन का लगभग कितना प्रतिशत है ?
View SolutionThe table shows the production of different types of cars (in thousands).
यह तालिका एक कंपनी द्वारा 5 वर्षों में अलग-अलग कारों के उत्पादन (हज़ार में ) को दर्शाती है | The total production of type E cars in 2012 and 2013 is approximately what percent more than the average production of type A cars during the years 2012 to 2016?
2012 और 2013 में E प्रकार की कारों का कुल उत्पादन 2012 से 2016 के दौरान A प्रकार की कारों के औसत उत्पादन से लगभग कितना प्रतिशत अधिक है ?
View SolutionThe table shows the production of different types of cars (in thousands).
यह तालिका एक कंपनी द्वारा 5 वर्षों में अलग-अलग कारों के उत्पादन (हज़ार में ) को दर्शाती है | If the data related to the production of type D cars is represented by a pie chart, then the central angle of the sector representing the production of
cars in 2013 will be:
यदि D प्रकार की कारों के उत्पादन से संबंधित आंकड़ों को एक पाई-चार्ट में प्रस्तुत किया जाए, तो 2013 में कारों के उत्पादन को दर्शाने वाले खंड का केंद्रीय कोण होगा :
View SolutionThe table shows the production of different types of cars (in thousands).
यह तालिका एक कंपनी द्वारा अलग-अलग कारों के उत्पादन ( हज़ार में ) को दर्शाती है |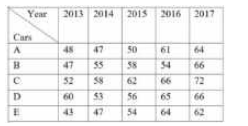 The total production of type B cars during 2013 to 2016 is approximately what percent less than the total production of cars in 2017?
2013 से 2016 के दौरान B प्रकार की कारों का कुल उत्पादन 2017 में कारों के कुल उत्पादन से लगभग कितना प्रतिशत कम है ?
View SolutionThe table shows the production of different types of cars (in thousands).
यह तालिका एक कंपनी द्वारा अलग-अलग कारों के उत्पादन ( हज़ार में ) को दर्शाती है |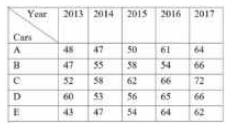 The total production of type B cars in 2015 and type C cars in 2013 is what percent more than the total production of type E cars in 2013 and 2014 ? (Correct to one decimal place)
2015 में B प्रकार तथा 2013 में प्रकार की कारों का कुल उत्पादन 2013 तथा 2014 में E प्रकार की कारों के कुल उत्पादन से कितना प्रतिशत अधिक है ? (एक दशमलव स्थान तक)
View SolutionThe table shows the production of different types of cars (in thousands).
यह तालिका एक कंपनी द्वारा अलग-अलग कारों के उत्पादन ( हज़ार में ) को दर्शाती है |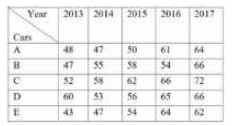 The ratio of the total production of type A cars in 2017 and type D cars in 2015 to the total production of type B and type E cars in 2013 is:
2017 में A प्रकार तथा 2015 में प्रकार की कारों के कुल उत्पादन का 2013 में B और E प्रकार की कारों के कुल उत्पादन के साथ अनुपात ज्ञात करें |
View SolutionThe table shows the production of different types of cars (in thousands).
यह तालिका एक कंपनी द्वारा अलग-अलग कारों के उत्पादन ( हज़ार में ) को दर्शाती है |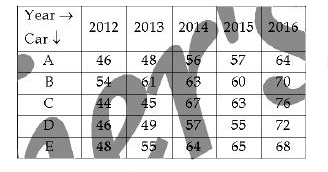
If the data related to the production of type E cars is represented by a pie-chart, then the central angle of the sector representing production of cars in 2013 will be:
यदि E प्रकार की कारों के उत्पादन से संबंधित आंकड़ों को एक पाई-चार्ट में प्रस्तुत किया जाए, तो 2013 में कारों के उत्पादन को दर्शाने वाले खंड का केंद्रीय कोण होगा :
View SolutionThe table shows the production of different types of cars (in thousands).
यह तालिका एक कंपनी द्वारा अलग-अलग कारों के उत्पादन ( हज़ार में ) को दर्शाती है |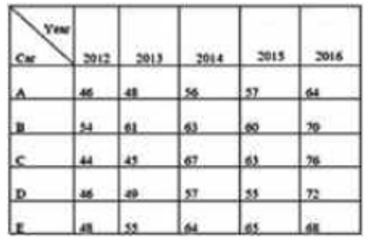 The average production of type C cars during 2012 to 2016 is approximately what percent less than the total production of type D cars in 2012 and type E cars in 2014?
2012 से 2016 के दौरान C प्रकार की कारों का औसत उत्पादन 2012 में D प्रकार एवं 2014 में E प्रकार की कारों के कुल उत्पादन से लगभग कितना प्रतिशत कम है ?
View SolutionThe table shows the production of different types of cars (in thousands).
यह तालिका एक कंपनी द्वारा अलग-अलग कारों के उत्पादन ( हज़ार में ) को दर्शाती है |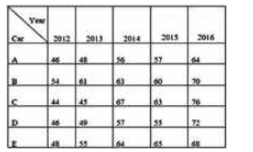 The ratio of the total production of type A cars in 2014 and 2016 and type C cars in 2013 taken together to the total production of type B cars and type D cars taken together in 2014 is:
2014 तथा 2016 में A प्रकार एवं 2013 में C प्रकार की कारों के कुल उत्पादन ( संयुक्त रूप से ) का 2014 में B प्रकार और D प्रकार की कारों के कुल उत्पादन के साथ अनुपात ज्ञात करें |
View SolutionThe table shows the production of different types of cars (in thousands).
यह तालिका एक कंपनी द्वारा अलग-अलग कारों के उत्पादन (हज़ार में ) को दर्शाती है |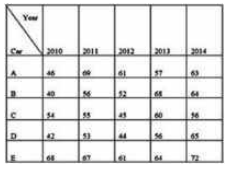 If the data related to the production of type C cars is represented by a pie-chart, then the central angle of the sector representing production of cars in 2012 will be:
यदि C प्रकार की कारों के उत्पादन से संबंधित आंकड़ों को एक पाई-चार्ट में प्रस्तुत किया जाए, तो 2012 में कारों के उत्पादन को दर्शाने वाले खंड का केंद्रीय कोण होगा :
View SolutionThe table shows the production of different types of cars (in thousands).
यह तालिका एक कंपनी द्वारा अलग-अलग कारों के उत्पादन (हज़ार में ) को दर्शाती है |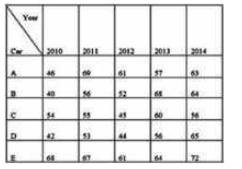 The average production of all type of cars in 2014 is approximately what percent less than the total production of type B cars in 2013 and type D cars in
2010 taken together?
2014 में सभी प्रकार की कारों का औसत उत्पादन 2013 में B प्रकार तथा 2010 में D प्रकार की कारों के कुल उत्पादन से लगभग कितना प्रतिशत कम है ?
View Solution