The given table represents the production of different types of motorcycles (in thousands) over a period of six years. Study the table carefully and answer the questions that follows:
दी गयी तालिका छः वर्षों की अवधि के दौरान अलग-अलग प्रकार की मोटर साइकिलों के उत्पादन ( हज़ार में ) को दर्शाती है | इस तालिका का ध्यानपूर्वक अध्ययन करें तथा फिर
पूछे गए प्रश्नों का उत्तर दीजिए |
 By what percentage is the total production of type A motorcycles over six years, less than the total
production of all types of motorcycles in 2013 and 2016?
इन छः वर्षों में A प्रकार की मोटरसाइकिल का कुल उत्पादन 2013 तथा 2016 में सभी प्रकार की मोटर साइकिलों के कुल उत्पादन से कितना प्रतिशत कम रहा है ?
32.2
32.8
31.6
30.5
Step by step video & image solution for The given table represents the production of different types of motorcycles (in thousands) over a period of six years. Study the table carefully and answer the questions that follows: दी गयी तालिका छः वर्षों की अवधि के दौरान अलग-अलग प्रकार की मोटर साइकिलों के उत्पादन ( हज़ार में ) को दर्शाती है | इस तालिका का ध्यानपूर्वक अध्ययन करें तथा फिर पूछे गए प्रश्नों का उत्तर दीजिए | By what percentage is the total production of type A motorcycles over six years, less than the total production of all types of motorcycles in 2013 and 2016? इन छः वर्षों में A प्रकार की मोटरसाइकिल का कुल उत्पादन 2013 तथा 2016 में सभी प्रकार की मोटर साइकिलों के कुल उत्पादन से कितना प्रतिशत कम रहा है ? by Maths experts to help you in doubts & scoring excellent marks in Class 14 exams.
Updated on:21/07/2023Topper's Solved these Questions
Similar Questions
The graphs of the equations 3x+y-5=0 and 2x-y-5=0 intersect at the point P(α,β). What is the value of (3α+β) ?
समीकरण 3x+y-5=0 तथा 2x-y-5=0 के आरेख एक बिंदु P(α,β) पर एक-दूसरे को काटते है (3α+β) का मान क्या है ?
View SolutionAfter giving two successive discounts, each of x%, on the marked price of an article, total discount is Rs. 259.20. If the marked price of the article is Rs. 720, then the value of x is :
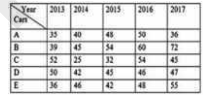
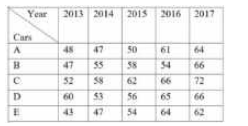
View SolutionThe table shows the production of different types of cars (in thousands). यह तालिका अलग-अलग प्रकार के कारों का उत्पादन ( हज़ार में) दर्शाती है | What is the ratio of the total production of cars of type A in 2014 and type C in 2013 taken together to the total production of cars of type B in 2016 and type E in 2015 taken together? 2014 में A प्रकार की कारों और 2013 में C प्रकार की कारों के कु ल उत्पादन का 2016 में B प्रकार की कारों और 2015 में E प्रकार की कारों के कुल उत्पादन के साथ अनुपात ज्ञात करें |
View SolutionThe table shows the production of different types of cars (in thousands). यह तालिका अलग-अलग प्रकार के कारों का उत्पादन ( हज़ार में) दर्शाती है | The number of years, in which the production of cars of type B is less than the average production of type D cars over the years is: कितने वर्ष B प्रकार की कारों का उत्पादन इन वर्षों के दौरान D प्रकार की कारों के औसत उत्पादन से कम रहा है ?
View SolutionThe table shows the production of different types of cars (in thousands)
यह तालिका अलग-अलग प्रकार के कारों का उत्पादन ( हज़ार में ) दर्शाती है | The production of cars of type A in 2015 and of type C in 2013 taken together is approximately what percent of the total production of cars of type D in five years?
2015 में A प्रकार की कारों का उत्पादन तथा 2013 में C प्रकार की कारों के उत्पादन को मिला दिया जाए, तो ये पांच वर्षों में D प्रकार की कारों के कुल उत्पादन का लगभग कितना प्रतिशत है ?
View SolutionThe table shows the production of different types of cars (in thousands).
यह तालिका एक कंपनी द्वारा अलग-अलग कारों के उत्पादन ( हज़ार में ) को दर्शाती है | The total production of type B cars during 2013 to 2016 is approximately what percent less than the total production of cars in 2017?
2013 से 2016 के दौरान B प्रकार की कारों का कुल उत्पादन 2017 में कारों के कुल उत्पादन से लगभग कितना प्रतिशत कम है ?
View SolutionThe table shows the production of different types of cars (in thousands).
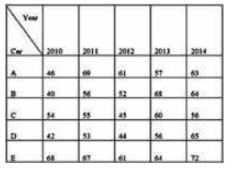
यह तालिका एक कंपनी द्वारा अलग-अलग कारों के उत्पादन (हज़ार में ) को दर्शाती है | The total production of type A cars in 2011, and type C cars and type E cars in 2012 taken together
is what percent of the total production of type B cars during 2010 to 2014?
2011 में A प्रकार की कारों तथा 2012 में C प्रकार एवं E प्रकार की कारों का कुल उत्पादन ( सब को मिलाकर ) 2010 से 2014 के दौरान B प्रकार की कारों के कुल उत्पादन का कितना प्रतिशत है ?
View SolutionThe table shows the production of different types of cars (in thousands). यह तालिका एक कंपनी द्वारा अलग-अलग कारों के उत्पादन (हज़ार में ) को दर्शाती है | The average production of type A cars during the five years is what percent of the total production of type C cars during the five years? पांच वर्षों के दौरान A प्रकार की कारों का औसत उत्पादन पांच वर्षों के दौरान C प्रकार की कारों के कुल उत्पादन का कितना प्रतिशत है ?
View SolutionThe given table shows the number (in thousands) of cars of five different models A, B, C, D and E produced during Years 2012-2017. Study the table and answer the questions that follows: दी गयी तालिका पाँच अलग-अलग मॉडलों- A, B, C, D और E की कारों की संख्या ( हज़ार में ) दर्शाती है, जिनका उत्पादन वर्ष 2012-2017 के दौरान किया गया है | इस तालिका का अध्ययन करें और फिर पूछे गए प्रश्न का उत्तर दें | If 2013 and 2014 are put together, which type of cars constitute exactly 25% of the total number of cars produced in those two years? यदि 2013 और 2014 को मिला दिया जाए, तो इन दो वर्षों में उत्पादित कारों की कुल संख्या का ठीक 25% भाग किस प्रकार की कारों का है ?
View SolutionThe given table represents the number of engineers recruited by four companies A,B,C and D over the years. Study the table carefully and answer the questions that follows: The number of years in which the number of engineers recruited by company D is less than the average number of engineers recruited by company B in the given six years, is: दी गयी तालिका चार कंपनियों A, B, C और D के द्वारा इन वर्षों के दौरान भर्ती किये गए इंजीनियरों की संख्या दर्शाती है | इस तालिका का ध्यानपूर्वक अध्ययन करें तथा इसके बाद पूछे गए प्रश्न का उत्तर दें | ऐसे कितने वर्ष हैं जिनमें कंपनी D के द्वारा भर्ती किये गए इंजीनियरों की संख्या दिए गए छः वर्षों की अवधि में कंपनी B के द्वारा भर्ती किये गए इंजीनियरों की औसत संख्या से कम है?
View SolutionThe given table represents the revenue (in ₹ crores) of a company from the sale of four products A,B,C and D in 6 years. Study the table carefully and answer the questions that follow. दी गयी तालिका एक कंपनी को चार उत्पादों -A, B, C तथा D की बिक्री से 6 वर्षों में होने वाली आय ( करोड़ रुपये में ) को दर्शाती है | इस तालिका का ध्यानपूर्वक अध्ययन करें तथा फिर पूछे गए प्रश्नों का उत्तर दें The number of years in which the revenue of the company from the sale of product D is more than the average revenue from the sale of product A over the six years is: ऐसे कितने वर्ष हैं जिनमें उत्पाद D की बिक्री से कंपनी को होने वाली आय इन छः वर्षों के दौरान उत्पाद A की बिक्री से हुई औसत आय से अधिक है ?
View SolutionThe given table represents the production of different types of motorcycles (in thousands) over a period of six years. Study the table carefully and answer the questions that follows: दी गयी तालिका छः वर्षों की अवधि के दौरान अलग-अलग प्रकार की मोटर साइकिलों के उत्पादन ( हज़ार में ) को दर्शाती है | इस तालिका का ध्यानपूर्वक अध्ययन करें तथा फिर पूछे गए प्रश्नों का उत्तर दीजिए | During 2015, the production of which type of motorcycle was more than 25% of the total production of all types of motorcycles in 2017? 2015 के दौरान, किस प्रकार की मोटरसाइकिल का उत्पादन 2017 में सभी प्रकार की मोटर साइकिलों के कुल उत्पादन के 25% से अधिक रहा है?
View SolutionThe given table represents the production of different types of motorcycles (in thousands) over a period of six years. Study the table carefully and answer the questions that follows: दी गयी तालिका छः वर्षों की अवधि के दौरान अलग-अलग प्रकार की मोटर साइकिलों के उत्पादन ( हज़ार में ) को दर्शाती है | इस तालिका का ध्यानपूर्वक अध्ययन करें तथा फिर पूछे गए प्रश्नों का उत्तर दीजिए | What is the percentage increase in the total production of all types of motorcycles from 2014to 2018? 2014 से 2018 तक सभी प्रकार की मोटरसाइकिल के कुल उत्पादन में कितने प्रतिशत की वृद्धि हुई है ?
View SolutionThe given table represents the production of different types of motorcycles (in thousands) over a period of six years. Study the table carefully and answer the questions that follows: दी गयी तालिका छः वर्षों की अवधि के दौरान अलग-अलग प्रकार की मोटर साइकिलों के उत्पादन ( हज़ार में ) को दर्शाती है | इस तालिका का ध्यानपूर्वक अध्ययन करें तथा फिर पूछे गए प्रश्नों का उत्तर दीजिए | What is the ratio of the total number of motorcycles of type B produced in 2016 and 2018 to the total number of motorcycles of type D produced in 2013, 2015 and 2016? 2016 तथा 2018 में उत्पादित की गयी B प्रकार की मोटरसाइकिलों की कुल संख्या का 2013, 2015 और 2016 में उत्पादिति D प्रकार की मोटरसाइकिलों की कुल संख्या के साथ अनुपात ज्ञात कीजिए |
View SolutionThe given table represents the exports (in ₹ crores) of four items A,B, C and D over a period of six years. Study the table carefully and answer the questions that follows: दी गयी तालिका छः वर्षों की अवधि के दौरान चार वस्तुओं A, B, C और D के निर्यात ( करोड़ रुपये में ) को दर्शाती है | इस तालिका का अध्ययन करें तथा फिर पूछे गए प्रश्नों के उत्तर दें | In which year, the exports of item D were 1.4 times the average exports of item B during the six years? किस वर्ष वस्तु D का निर्यात छः वर्षों में वस्तु B के औसत निर्यात का 1.4 गुना रहा है ?
View Solution
