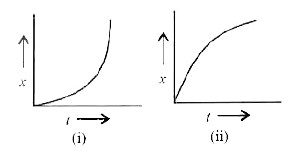
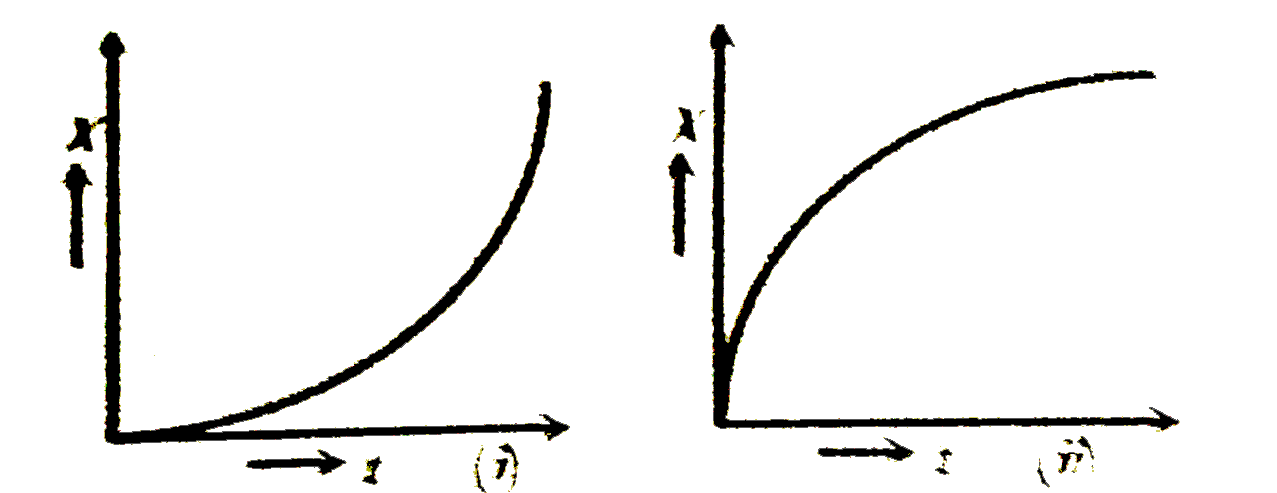
Figures (1) and (2) show the displacement time graphs of two particles moving along the x-axis. We can say that (The curves are parabola)

A
both the particles are in uniformly accelerated motion.
B
both the particles are m uniformly retarded motion
C
particle (1)is in uniformly accelerated motion while particle (2) is in uniformly retarded motion.
D
particle (1) is in uniformly retarded motion while particle (2) is in uniformly accelerated motion.
Text Solution
The correct Answer is:C
For an accelerated motion, velocity of particle increases. Thus the slope of x-t graph increases. For retarded motion, velocity of particle decreases. So slope of x-t graph decreases.
|
Similar Questions
Knowledge Check
Figure (i) and (i) show the displacement-time graphs of two particles moving along the x-axis. We can say that
 Aboth the particles are having a uniformly retarded motionBboth the particles are having a uniformly acceleraled motionCParticle (1) is having a uniformly accelerated motion while particle (i) is having a uniformly retarded motionDParticle (i) is having a uniformly retarded motion while particle (ii) is having a uniformly accelerated motion
Figures (i) and (ii) below show the displacement-time graphs of two particles moving along the x -axis. We can say that
 ABoth the particles are having a uniformly accelerated motionBBoth the particles are having a uniformly retarded motionCParticle (i) is having a uniformly accelerated motion while particle (ii) is having a uniformly retarded motionDParticle (i) is having a uniformly retarded motion while particle (ii) is having a uniformly accelerated motion
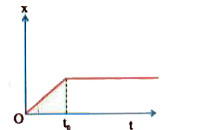
Figure show the displacement - time graph of a particle moving on the x-axis
 Athe particle is continuously going in positive X directionBthe particle is at restCthe velocity increases up to a time t0 and then becomes constant.Dthe particle moves at constant velocity up to a time t0 and then stops.
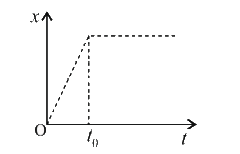
Figure shows the displacement time graph of a particle moving on the X-axis

View SolutionFigure shows the displacement-time graph of a particle moving on the X-axis

View SolutionFigure shows the displacement (x)-time (f) graph of a particle moving on the X-axis.

View SolutionDisplacement time graph of a particle moving in a straight line is a shown in figure.

View SolutionThe distance-time graph of a particle moving along a curved path is a straight line .
View Solution

