The graph shown the variation with times t of the velocity v of an object . Which one of the following graphs best represents the variation of acceleration a of the object with time t?
 Solution in Gujrati
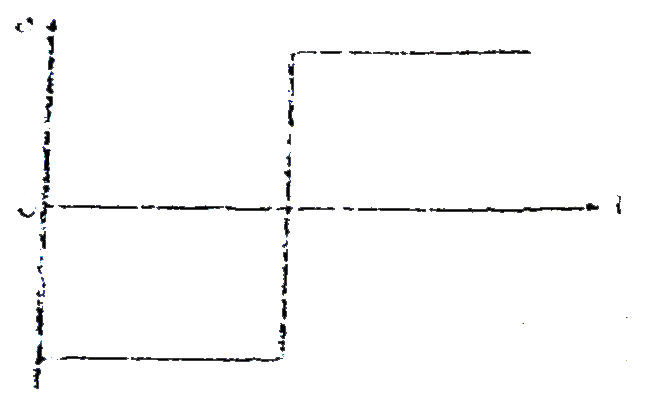
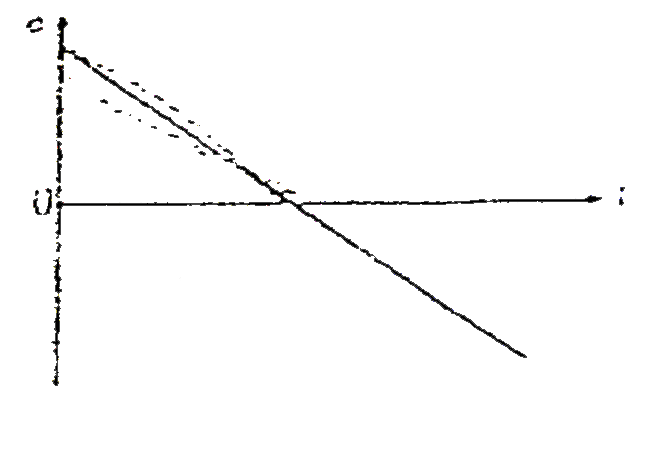
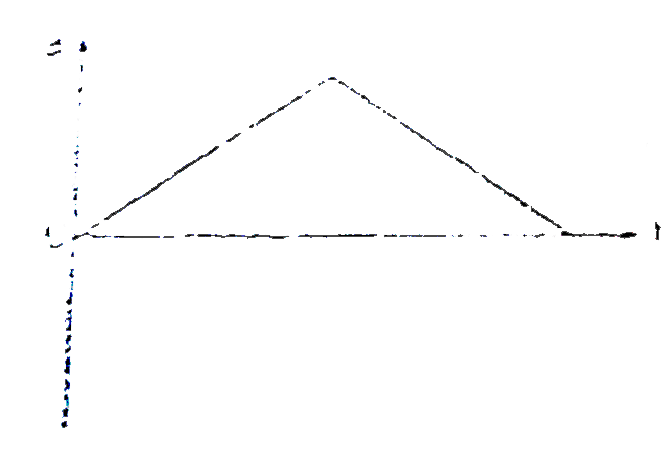
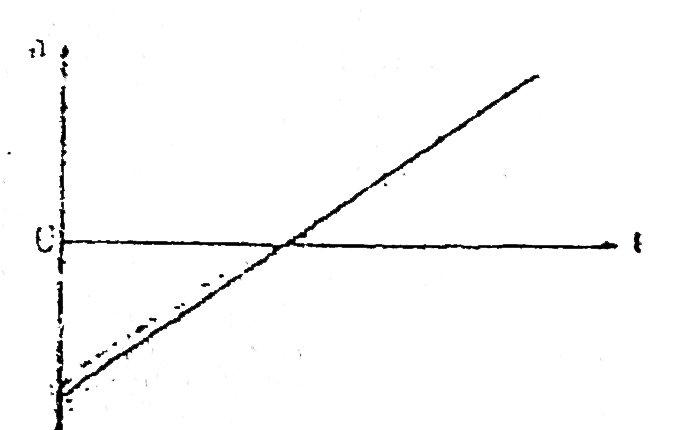
The correct Answer is:D
Ans. (4)
Acceleration a=dvdt and slope of a parabolic curve is a straight line.
Topper's Solved these Questions
- TEST PAPERBOOK - ALLEN CHAPTER - TEST PAPEREXERCISE - PHYSICS
4 Videos
- TEST PAPERBOOK - ALLEN CHAPTER - TEST PAPEREXERCISE - PHYSICS
4 Videos
- SIMPLE HARMONIC MOTIONBOOK - ALLEN CHAPTER - SIMPLE HARMONIC MOTIONEXERCISE - Example
1 Videos
- TEST PAPER 1BOOK - ALLEN CHAPTER - TEST PAPER 1EXERCISE - PHYSICS
11 Videos
Similar Questions
Choose the correct statement:
View SolutionChoose the correct statement:
View SolutionA rod with rectangular cross section oscillates about a horizontal axis passing through one of its ends and it behaves like a seconds pendulum, its length will be
View SolutionWhy are electric field lines perpendicular at a point on an equipotential surface of a conductor ?
View SolutionIn figure shown, the graph shows the variation of acceleration of body with time t . The velcocity of the body at t = 0 is zero. The velocity of the body at t = 30 s is.
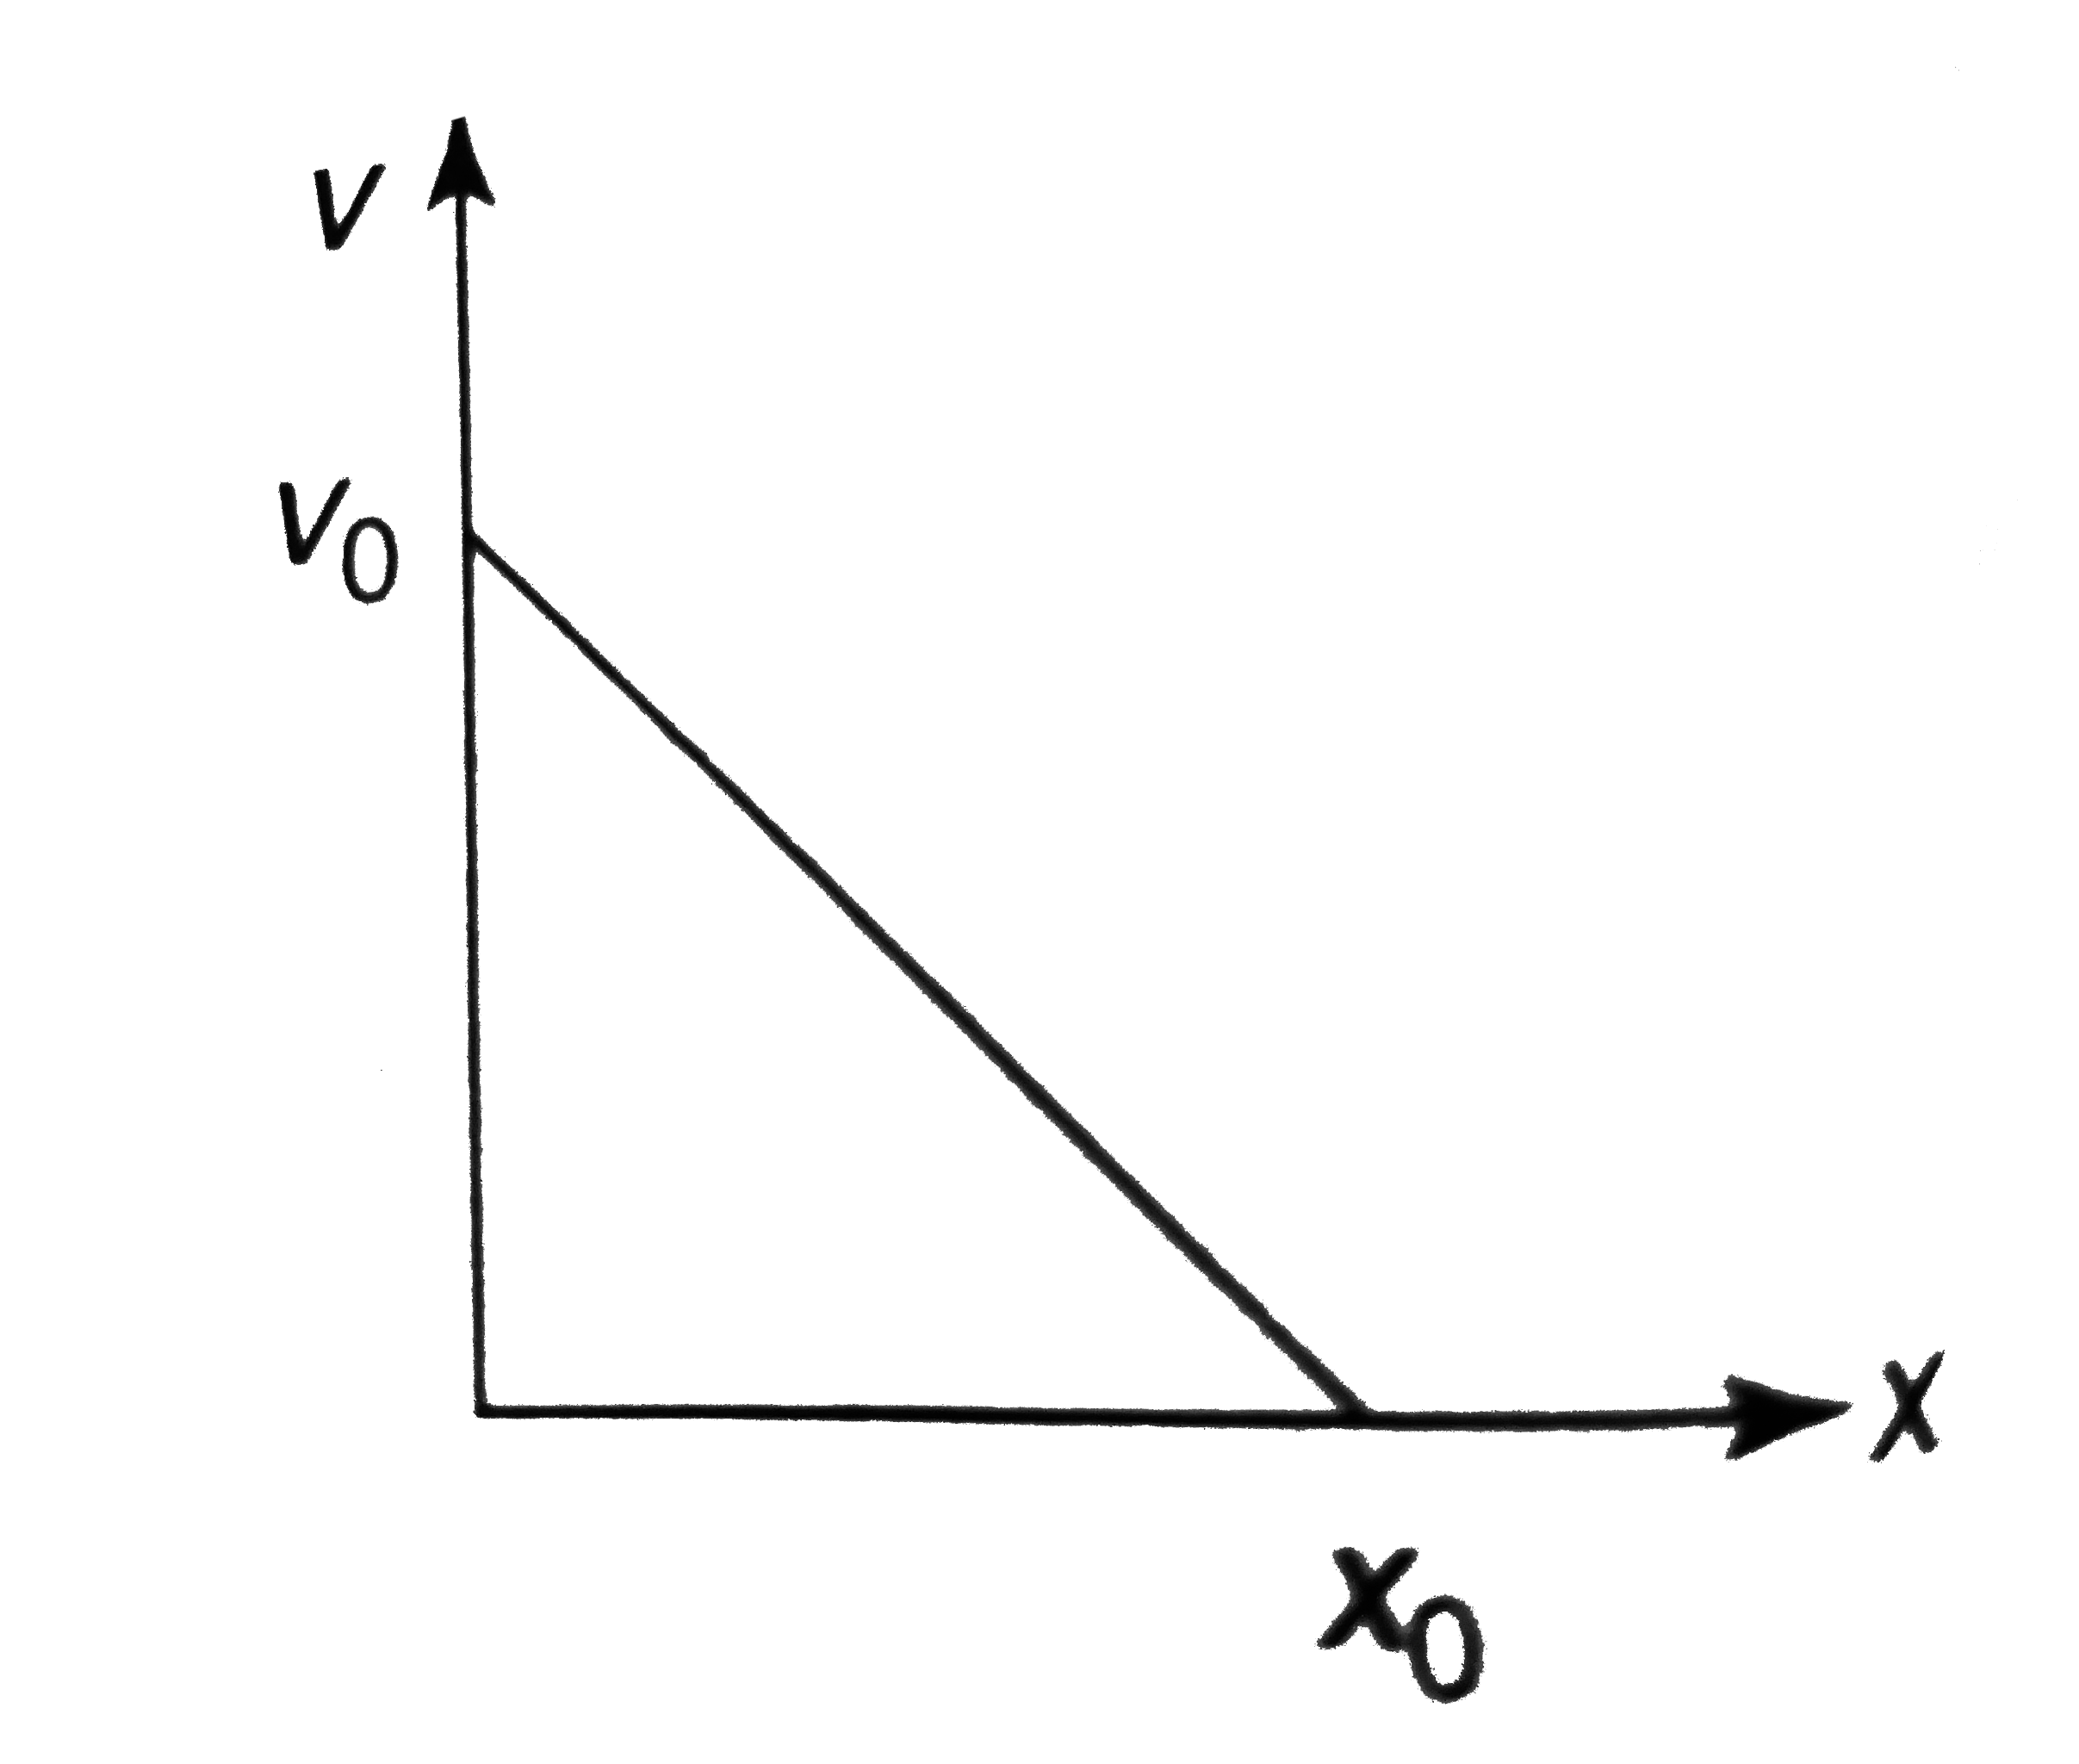
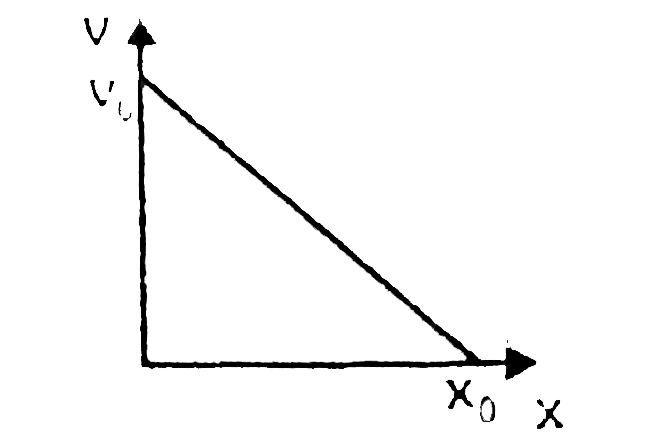
View SolutionThe given graph shows the variation of velocity with displacement. Which one of the graphs given below correctly represents the variation of acceleration with displacement ?
View SolutionWhich of the following graphs represents the variation of activity (A) of a radioactive substance with time (t).
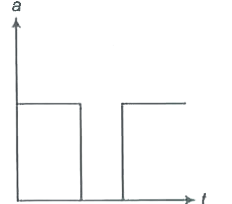
View SolutionThe graph in figure shows the velocity v versus time t for a body. Which of the graphs shown in figure represents the correesponding acceleration versus time graphs ?
View Solutionचित्र में किसी वस्तु के लिए त्वरण-समय ग्राफ प्रदर्शित किया गया है। इसी वस्तु के लिए वेग-समय ग्राफ होगा
View Solutionनिम्नांकित वेग (v)-समय (t) के बीच कौन सा ग्राफ एक गतिशील वस्तु की वास्तविक स्थिति को प्रदर्शित करता है:
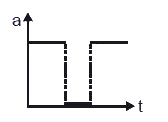
View Solutionकिसी वस्तु के लिये त्वरण-समय ग्राफ चित्र में दिखाया गया है। तो संगत वेग-समय ग्राफ होगा :
View SolutionA body is acted upon by a constant force fromtime t=0 to a time t=T after which it does not experience any force. Which of the following graphs best represents the variation of the velocity of the body with time ?
View SolutionVelocity -time (v-t) graph for a moving object is shown in the figure. Total displacement of the object during the time interval when there is non-zero acceleration and retardation is

View SolutionA graph of velocity versus time (v - t) for an object performing motion with uniform acceleration is shown What would be the velocity of the object at time t= 0?
View SolutionA graph of velocity-time (v-t) for an object performing motion is shown, what would you conclude about motion of the object?
View SolutionThe given graph shows the variation of velocity with displacement. Which one of the graph given below correctly represents the variation of acceleration with displacement :-
View Solution
