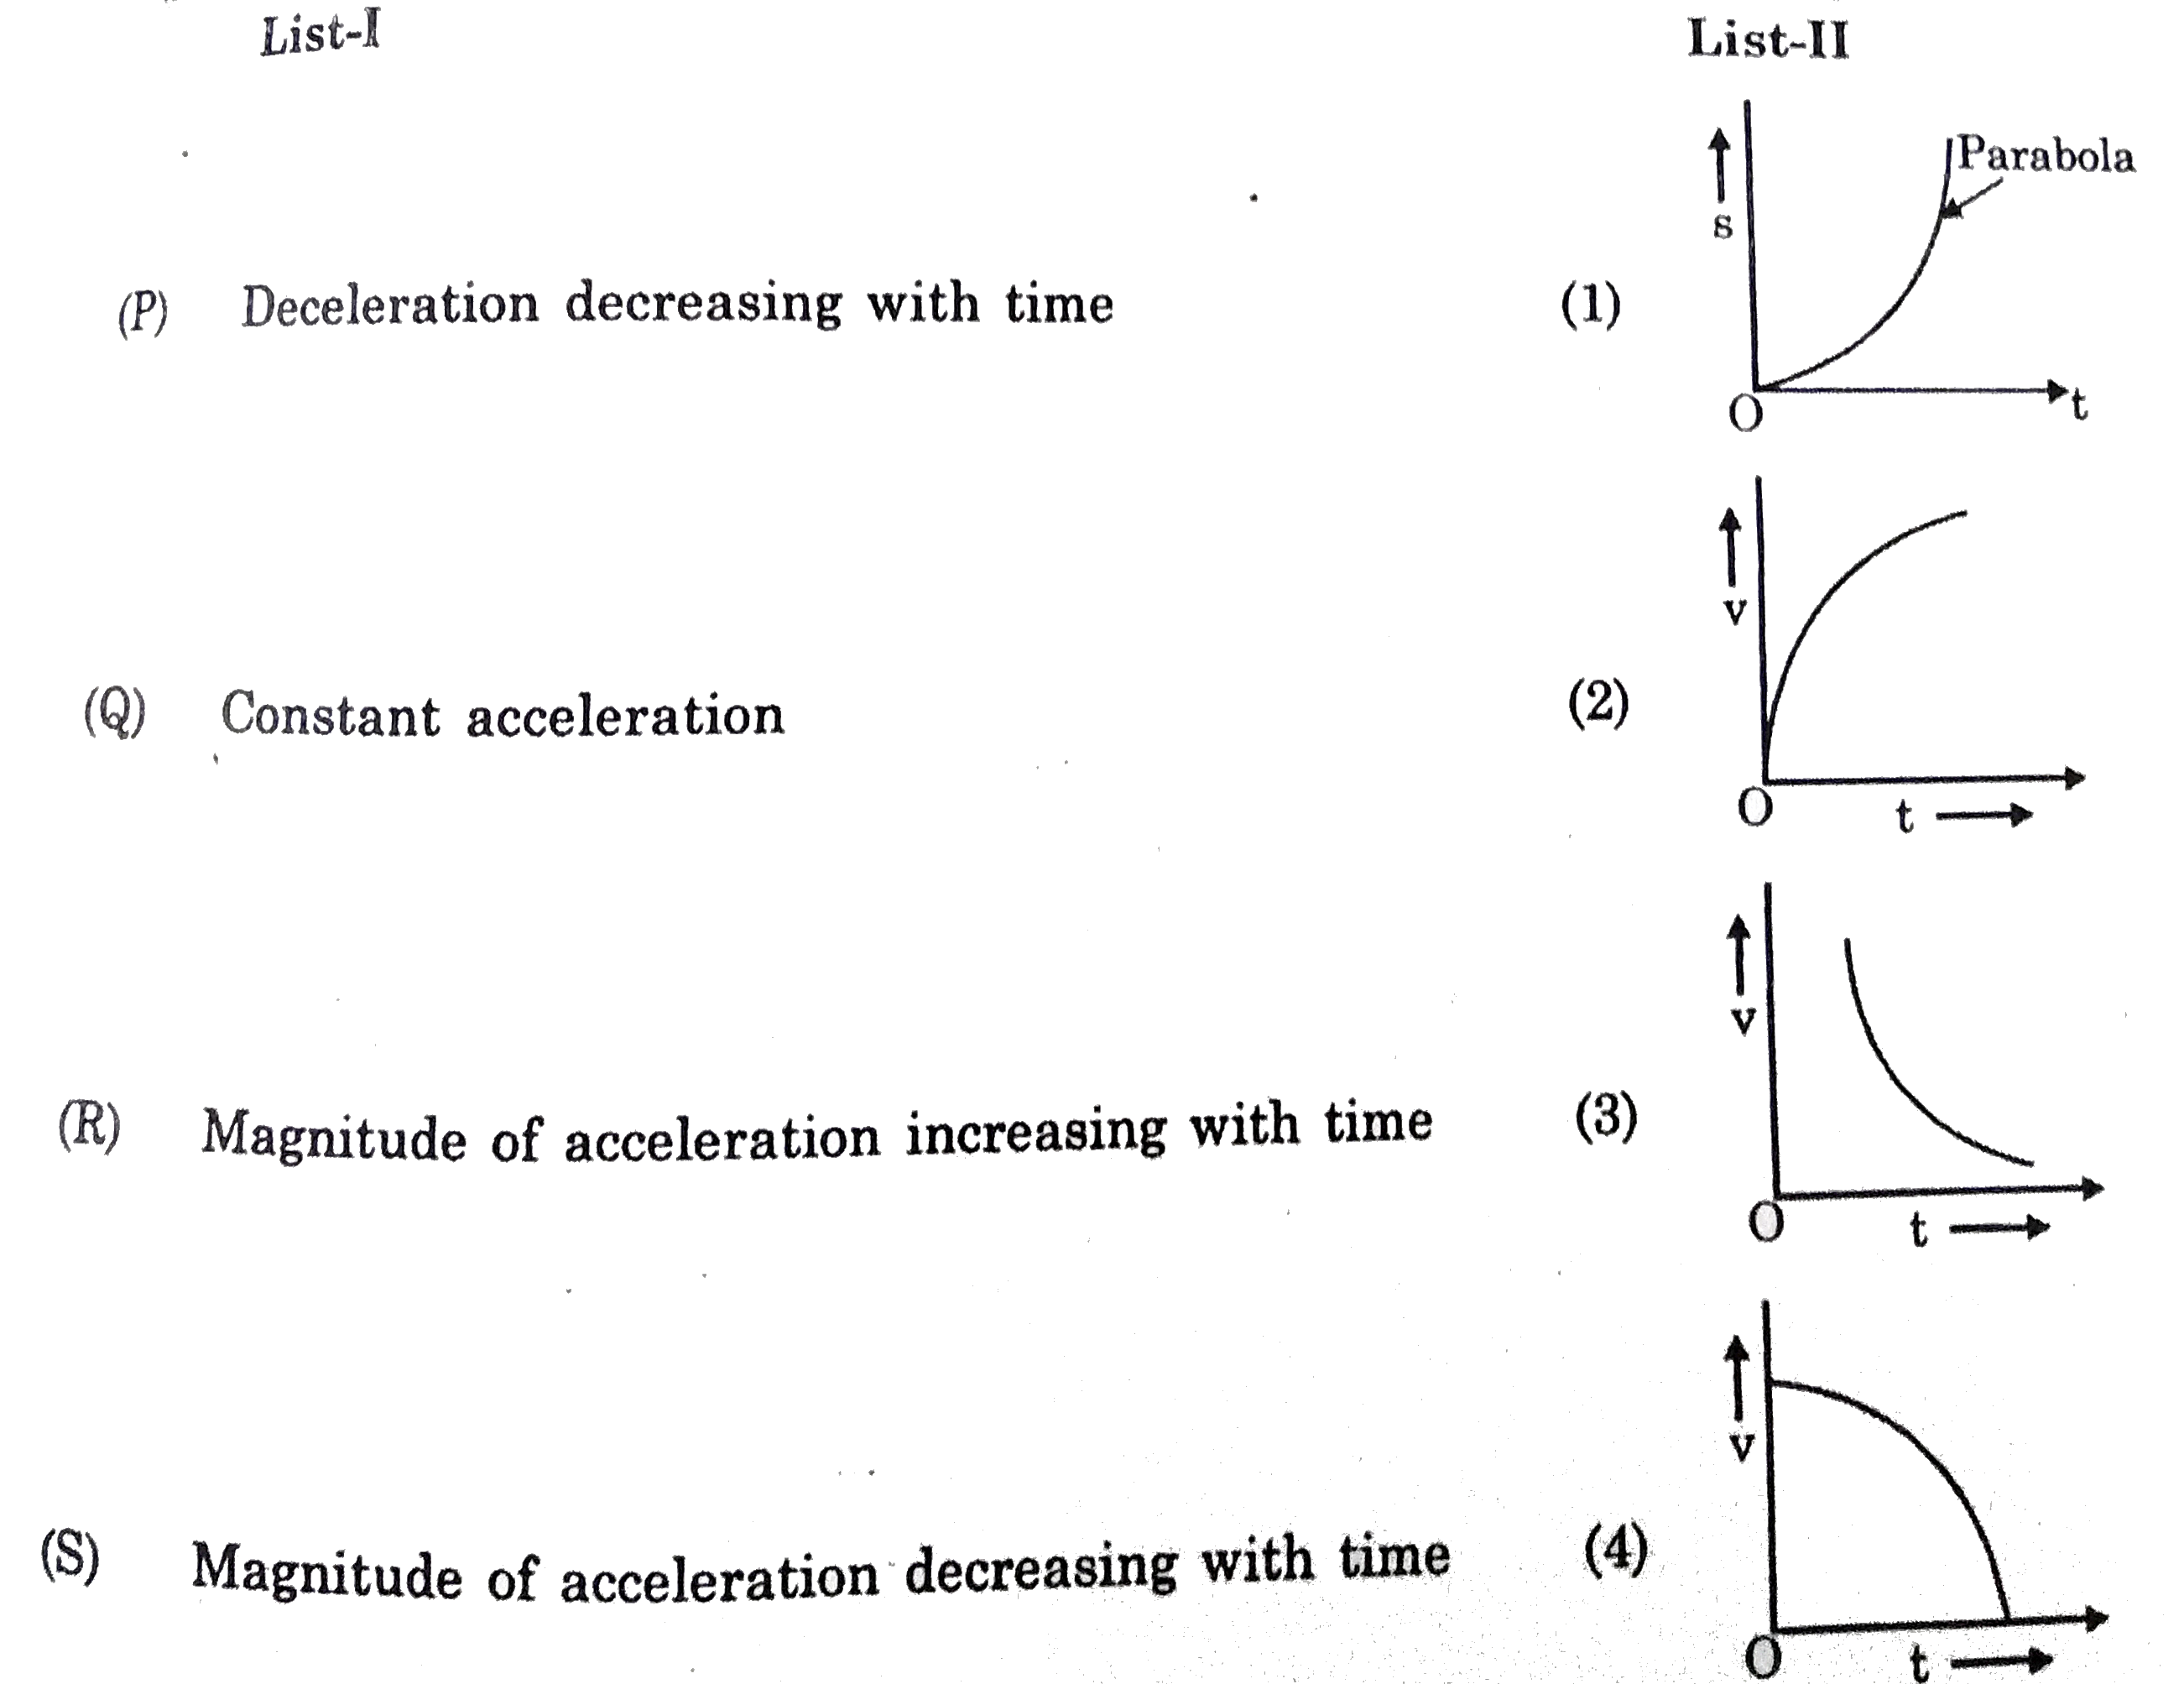
Match the following List I to List II
 Solution in Gujrati
Mass of one ca atom is 6.64×10⁻²³g
Volume of 18 g H2O at 1 atm pressure and 273 K temperature is 22.4 L
Number of oxygen atoms in
C4H6O2 sample is 2, if this sample has 6 g atom hydrogen
The correct Answer is:A
Step by step video solution for Match the following List I to List II by Maths experts to help you in doubts & scoring excellent marks in Class 12 exams.
Updated on:21/07/2023Topper's Solved these Questions
- TEST PAPERBOOK - ALLEN CHAPTER - TEST PAPEREXERCISE - MATHS
82 Videos
- TEST PAPERBOOK - ALLEN CHAPTER - TEST PAPEREXERCISE - MATHEMATICS
34 Videos
- TEST PAPERBOOK - ALLEN CHAPTER - TEST PAPEREXERCISE - CHEMISTRY SECTION-II
16 Videos
- SEQUENCE AND PROGRESSIONBOOK - ALLEN CHAPTER - SEQUENCE AND PROGRESSIONEXERCISE - Exercise (JA)
10 Videos
- TEST PAPERSBOOK - ALLEN CHAPTER - TEST PAPERSEXERCISE - MATHEMATICS
136 Videos
Similar Questions
Let a point P lies inside an equilateral △ABC such that its perpendicular distances from sides are P1,P2,P3.If side length of △ABC is 2 unit then
View Solution5∑k=01sin[(K+1)θ]sin[(K+2)θ] can be equal to
View SolutionThe molar mass of a substance , each molecule of which contains 9 C atoms , 13 H-atoms and 3.32×10⁻²³ g of other component is (NA=6.022×10²³)
View SolutionThe minimum value of the sum of real numbers a−5,a−4,3a−3,1,a8 and a10 with a>0 is
View SolutionIf a be sum of the odd numbered terms and b the sum of even numbered terms of the expansion (1+x)n,n ε N then (1−x2)n is equal to
View SolutionMatch the following lists:

View SolutionWhich of the following are correct chain isomers of butane ? (i)
View SolutionDetermine the point of symmetry of a regular hexagon.
View SolutionDtermine the images of the following figure about the given line :
View SolutionMatch the following Column A to Column B

View SolutionMatch the following Column A to Column B

View SolutionMatch the following Column A to Column B

View SolutionThe inequation represented by the graph given below is :
View SolutionThe inequation that best describes the graph given below is _________
View SolutionThe inequation that best describes the following graph is _________
View SolutionMatch the followings (column I with column II)
ltimg src="https://d10lpgp6xz60nq.cloudfront.net/physics_images/NCERT_BIO_XI_C03_E01_011_Q01.png" width="80%"gt
View Solution
