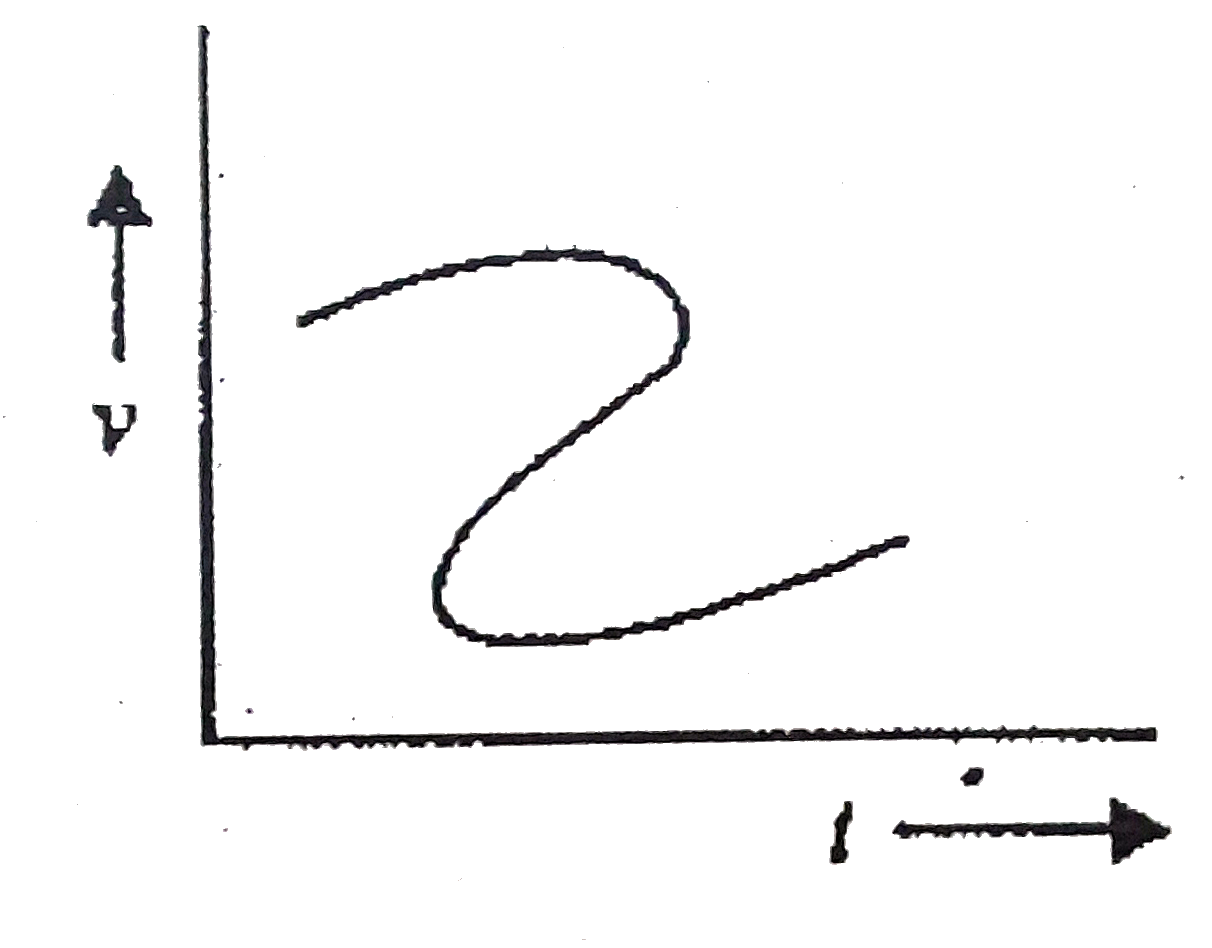
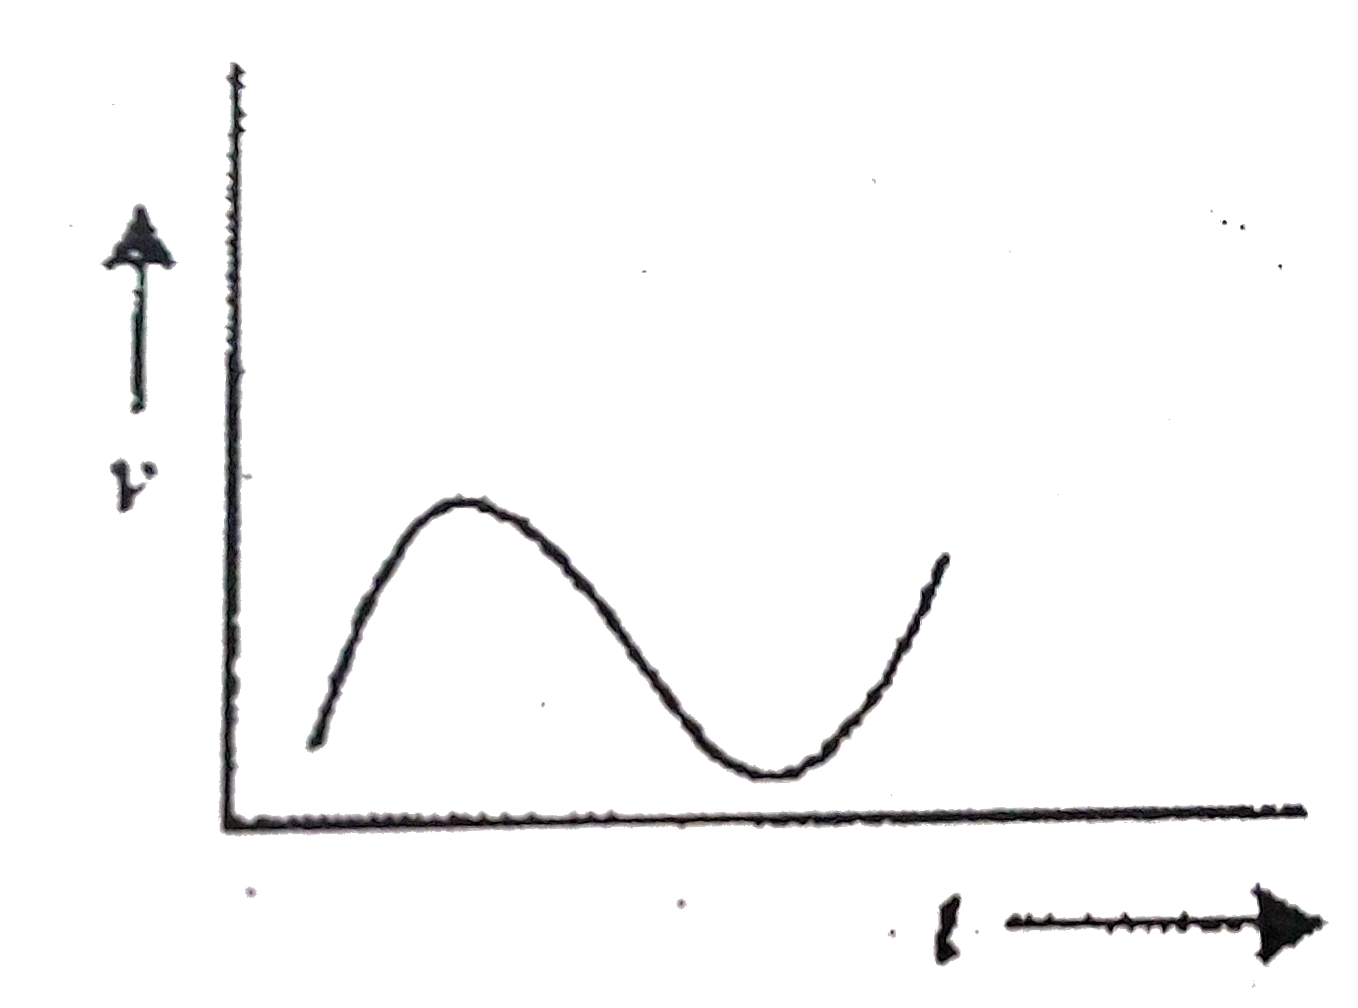
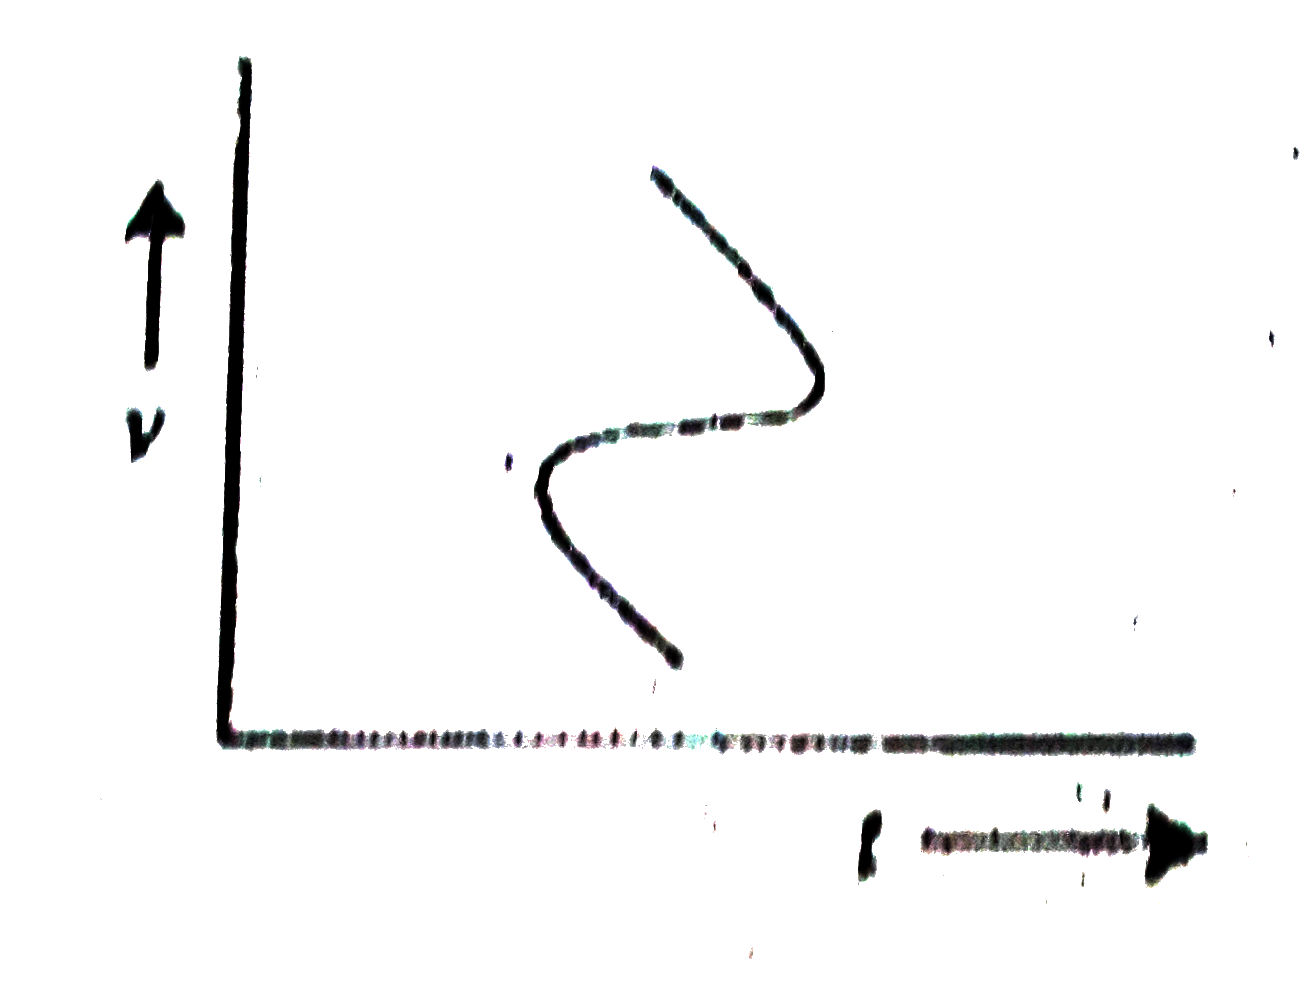
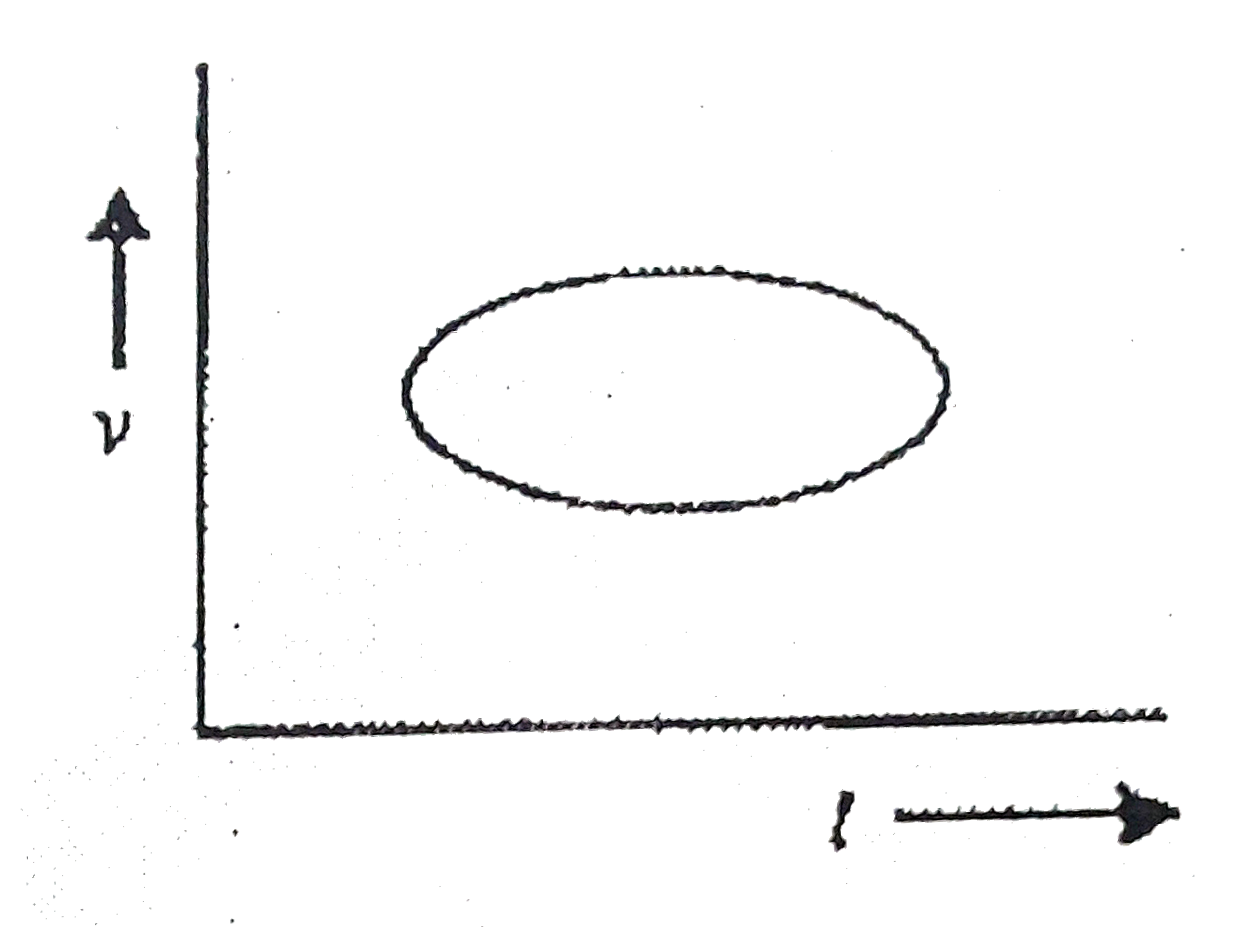
Which of the following velocity-time graphs shows a realistic situation for a body in motion ?
The correct Answer is:B
To determine which velocity-time graph shows a realistic situation for a body in motion, we need to analyze the characteristics of each graph. A realistic velocity-time graph must adhere to the following principles:
1. Single Velocity at a Given Time: At any specific moment in time, a body can only have one velocity. This means that for any given time t, there should be only one corresponding velocity v.
2. Continuous Motion: The graph should not depict any instantaneous jumps or discontinuities in velocity, as this would imply an unrealistic change in motion.
Now, let's analyze the options step by step:
Step 1: Analyze Each Graph
- Option A: This graph shows multiple velocities at the same time t1. For instance, at t1, there are three different velocities v1,v2, and v3. This violates the principle of having a single velocity at a given time.
- Option B: This graph shows a continuous line where at each time t, there is only one corresponding velocity. This adheres to the principle of having a single velocity at a given time, making it a realistic representation of motion.
- Option C: Similar to Option A, this graph also shows multiple velocities at a single time point. Thus, it is not a realistic graph.
- Option D: This graph also depicts multiple velocities at the same time, violating the same principle as Options A and C.
Step 2: Conclusion
After analyzing all the options, we can conclude that:
- Option B is the only graph that shows a realistic situation for a body in motion, as it maintains the principle of having a single velocity at any given time.
Final Answer
Option B is the correct answer.
---
- Option A: This graph shows multiple velocities at the same time t1. For instance, at t1, there are three different velocities v1,v2, and v3. This violates the principle of having a single velocity at a given time.
- Option B: This graph shows a continuous line where at each time t, there is only one corresponding velocity. This adheres to the principle of having a single velocity at a given time, making it a realistic representation of motion.
After analyzing all the options, we can conclude that:
- Option B is the only graph that shows a realistic situation for a body in motion, as it maintains the principle of having a single velocity at any given time.
Option B is the correct answer.
Similar Questions
Which of the following velocity-time graphs represent uniform motion
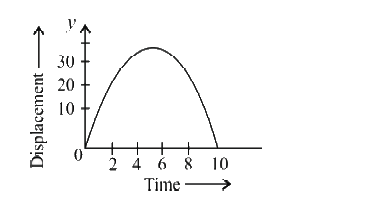
View SolutionThe displacement-time graph of a moving object is shown in figure. Which of the velocity-time graphs shown in figure could represent the motion of the same body ?
View SolutionFor a particle in motion which of the following speed-time graphs can be realized in practice :

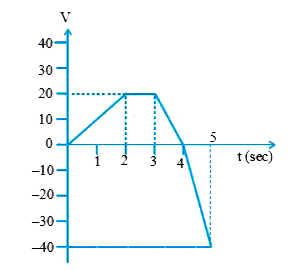
View SolutionIn the following velocity time graph of a body the distance travelled by the body and its displacement during 5 second in meter will be:
View SolutionAre the following velocity − time graph and speed − time graphs possible ?

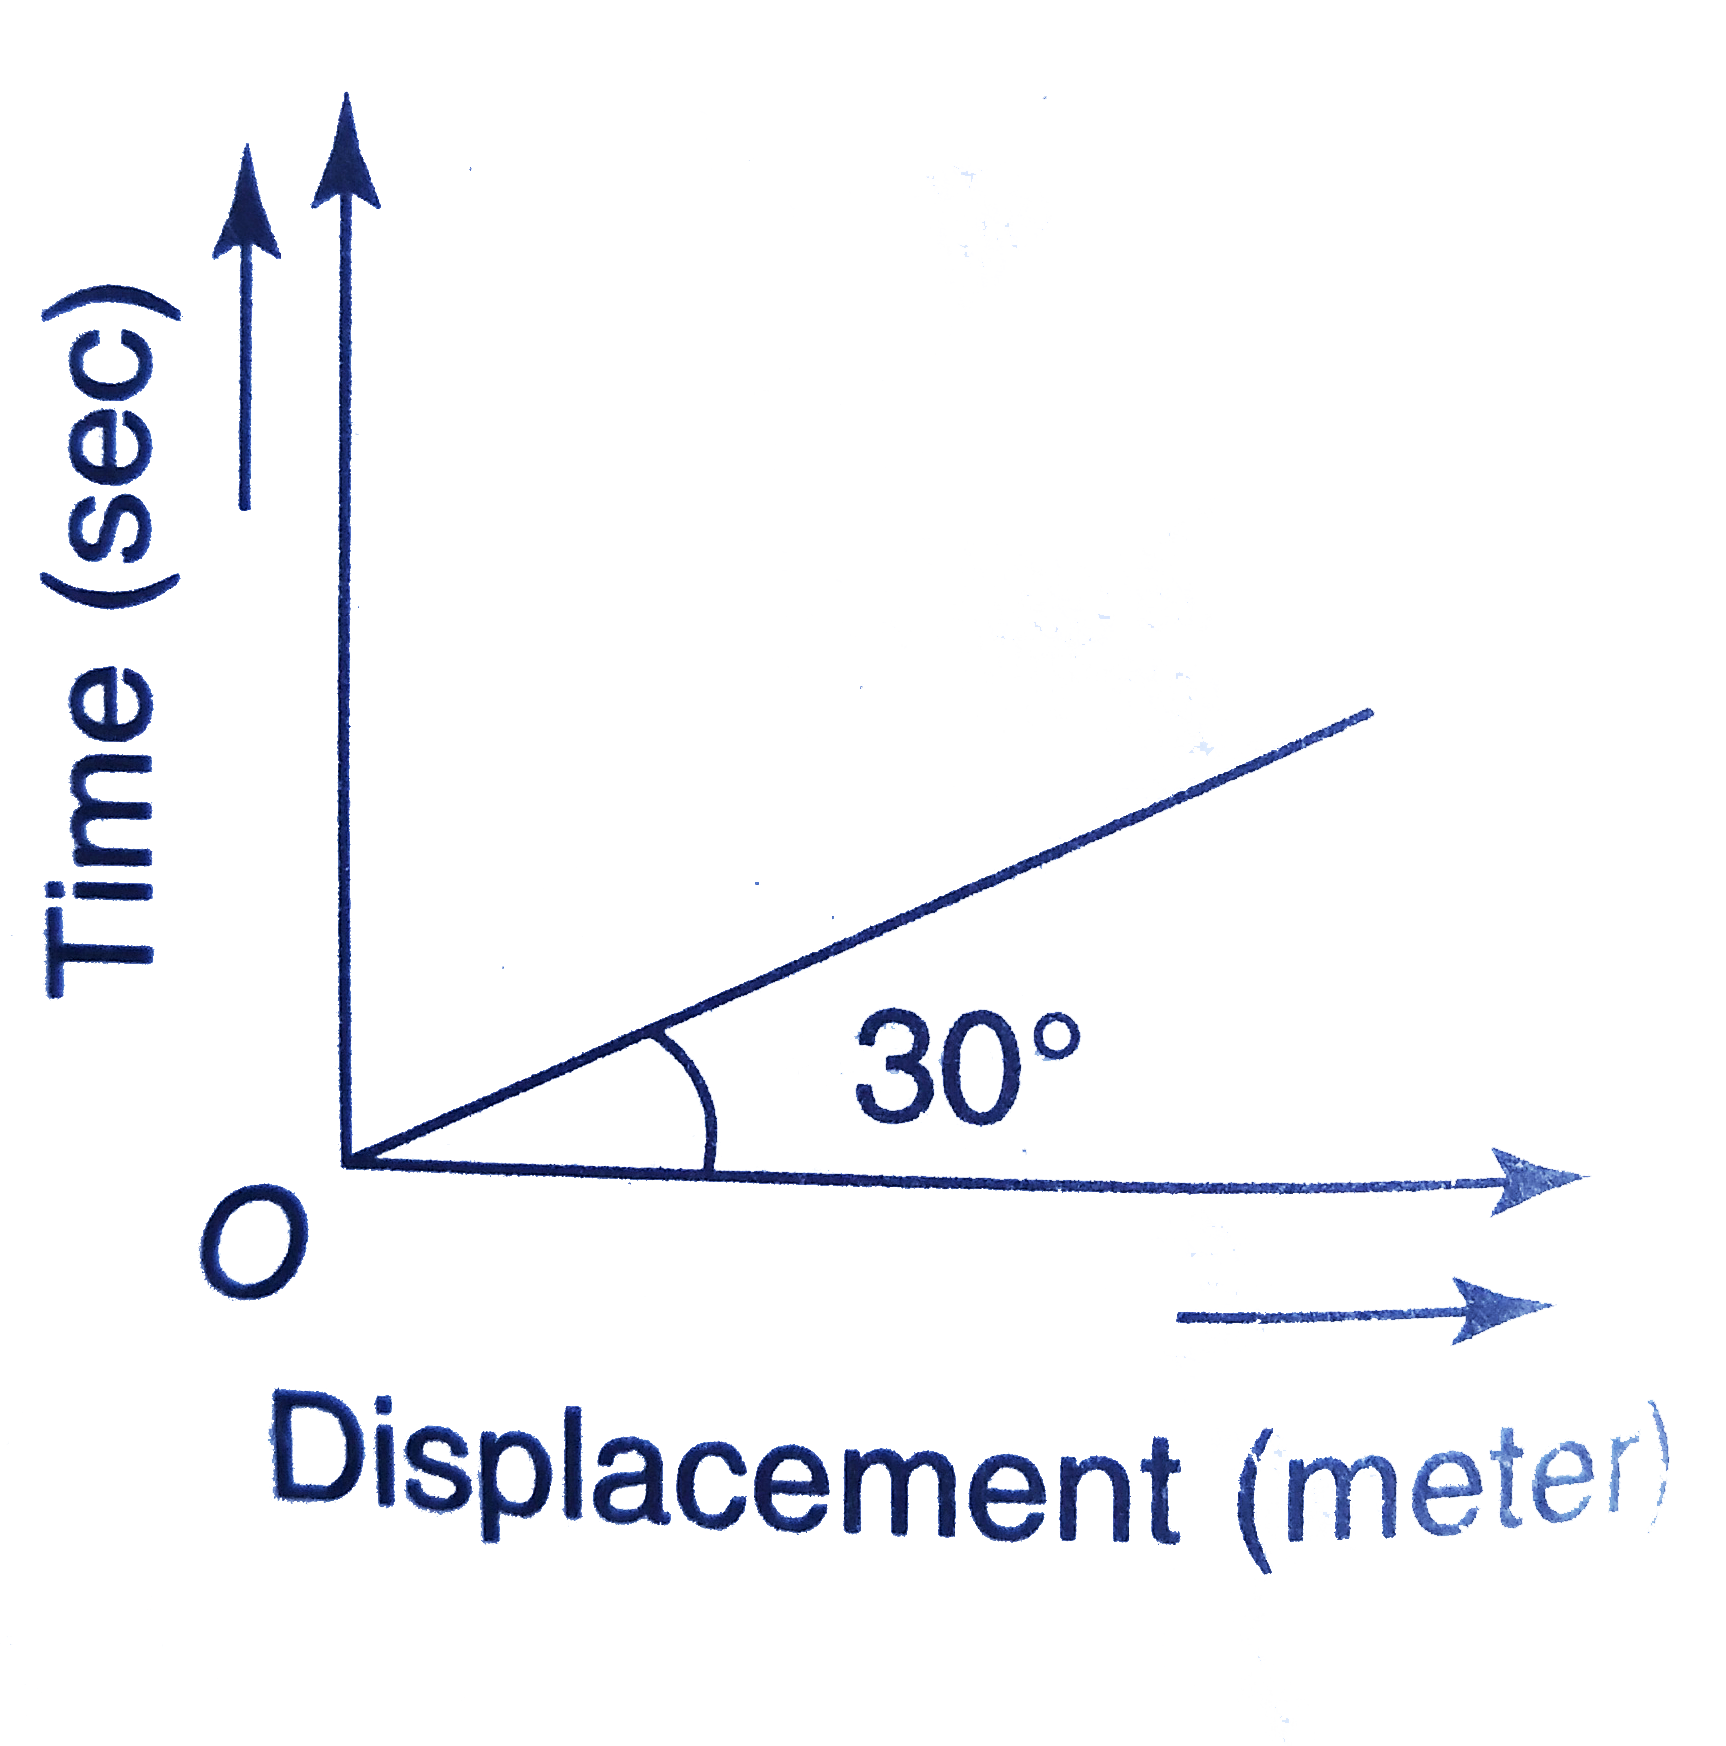
View SolutionFrom the following displacement-time graph find out the velocity of a moving body.
View SolutionThe velocity-time graph of particle comes out to be a non-linear curve. The motion is
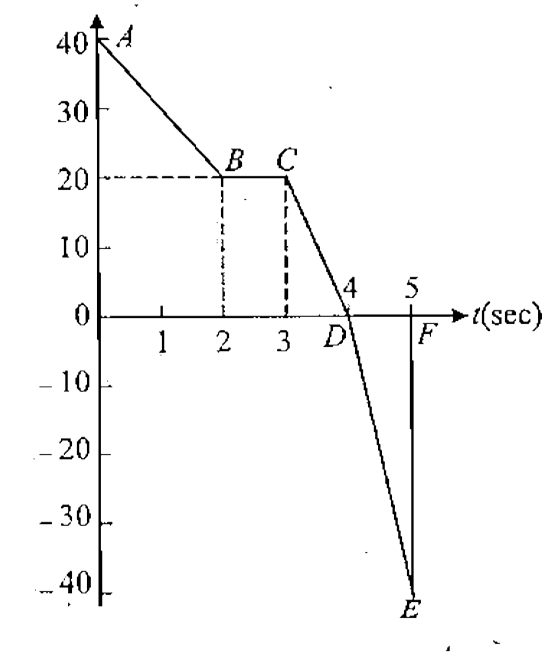
View SolutionIn the following velocity-time graph of a body, the distance and displacement travelled by the body in 5 seconds in meters will be:
View SolutionThe motion of a body is represented by the following displacement-time graph.
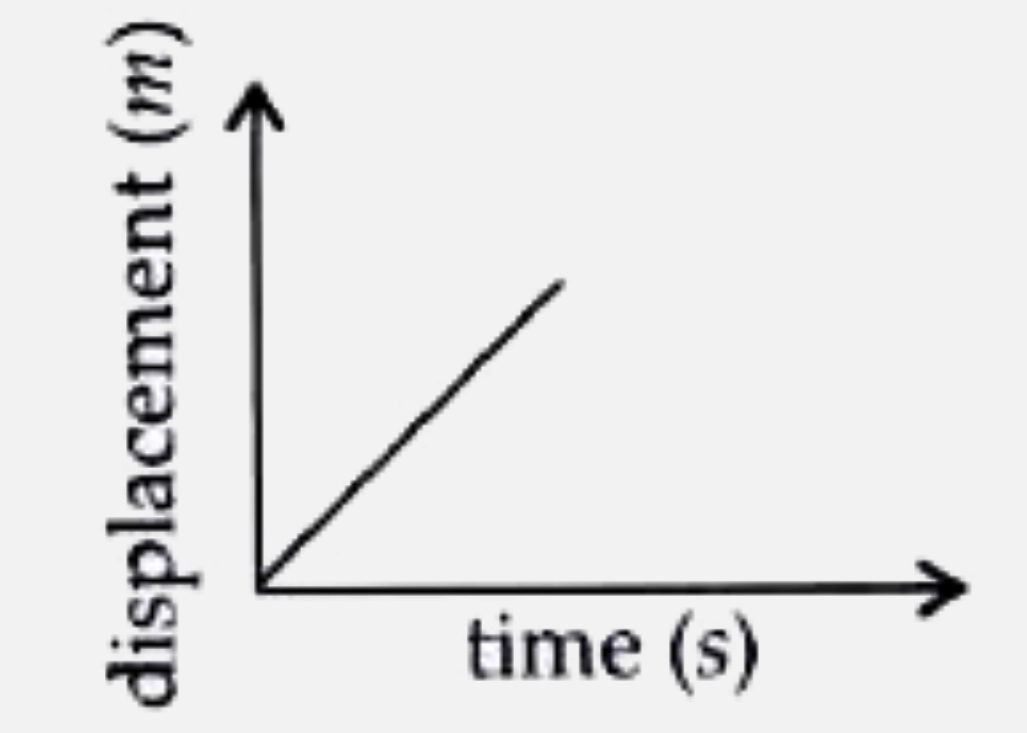
How can the velocity of the body be determined from the above graph?
View SolutionThe velocity-time graph of a particle in straight line motion is velocity-time graph of a particle in straight line motion is shown in. The particle starts its motion from origin.
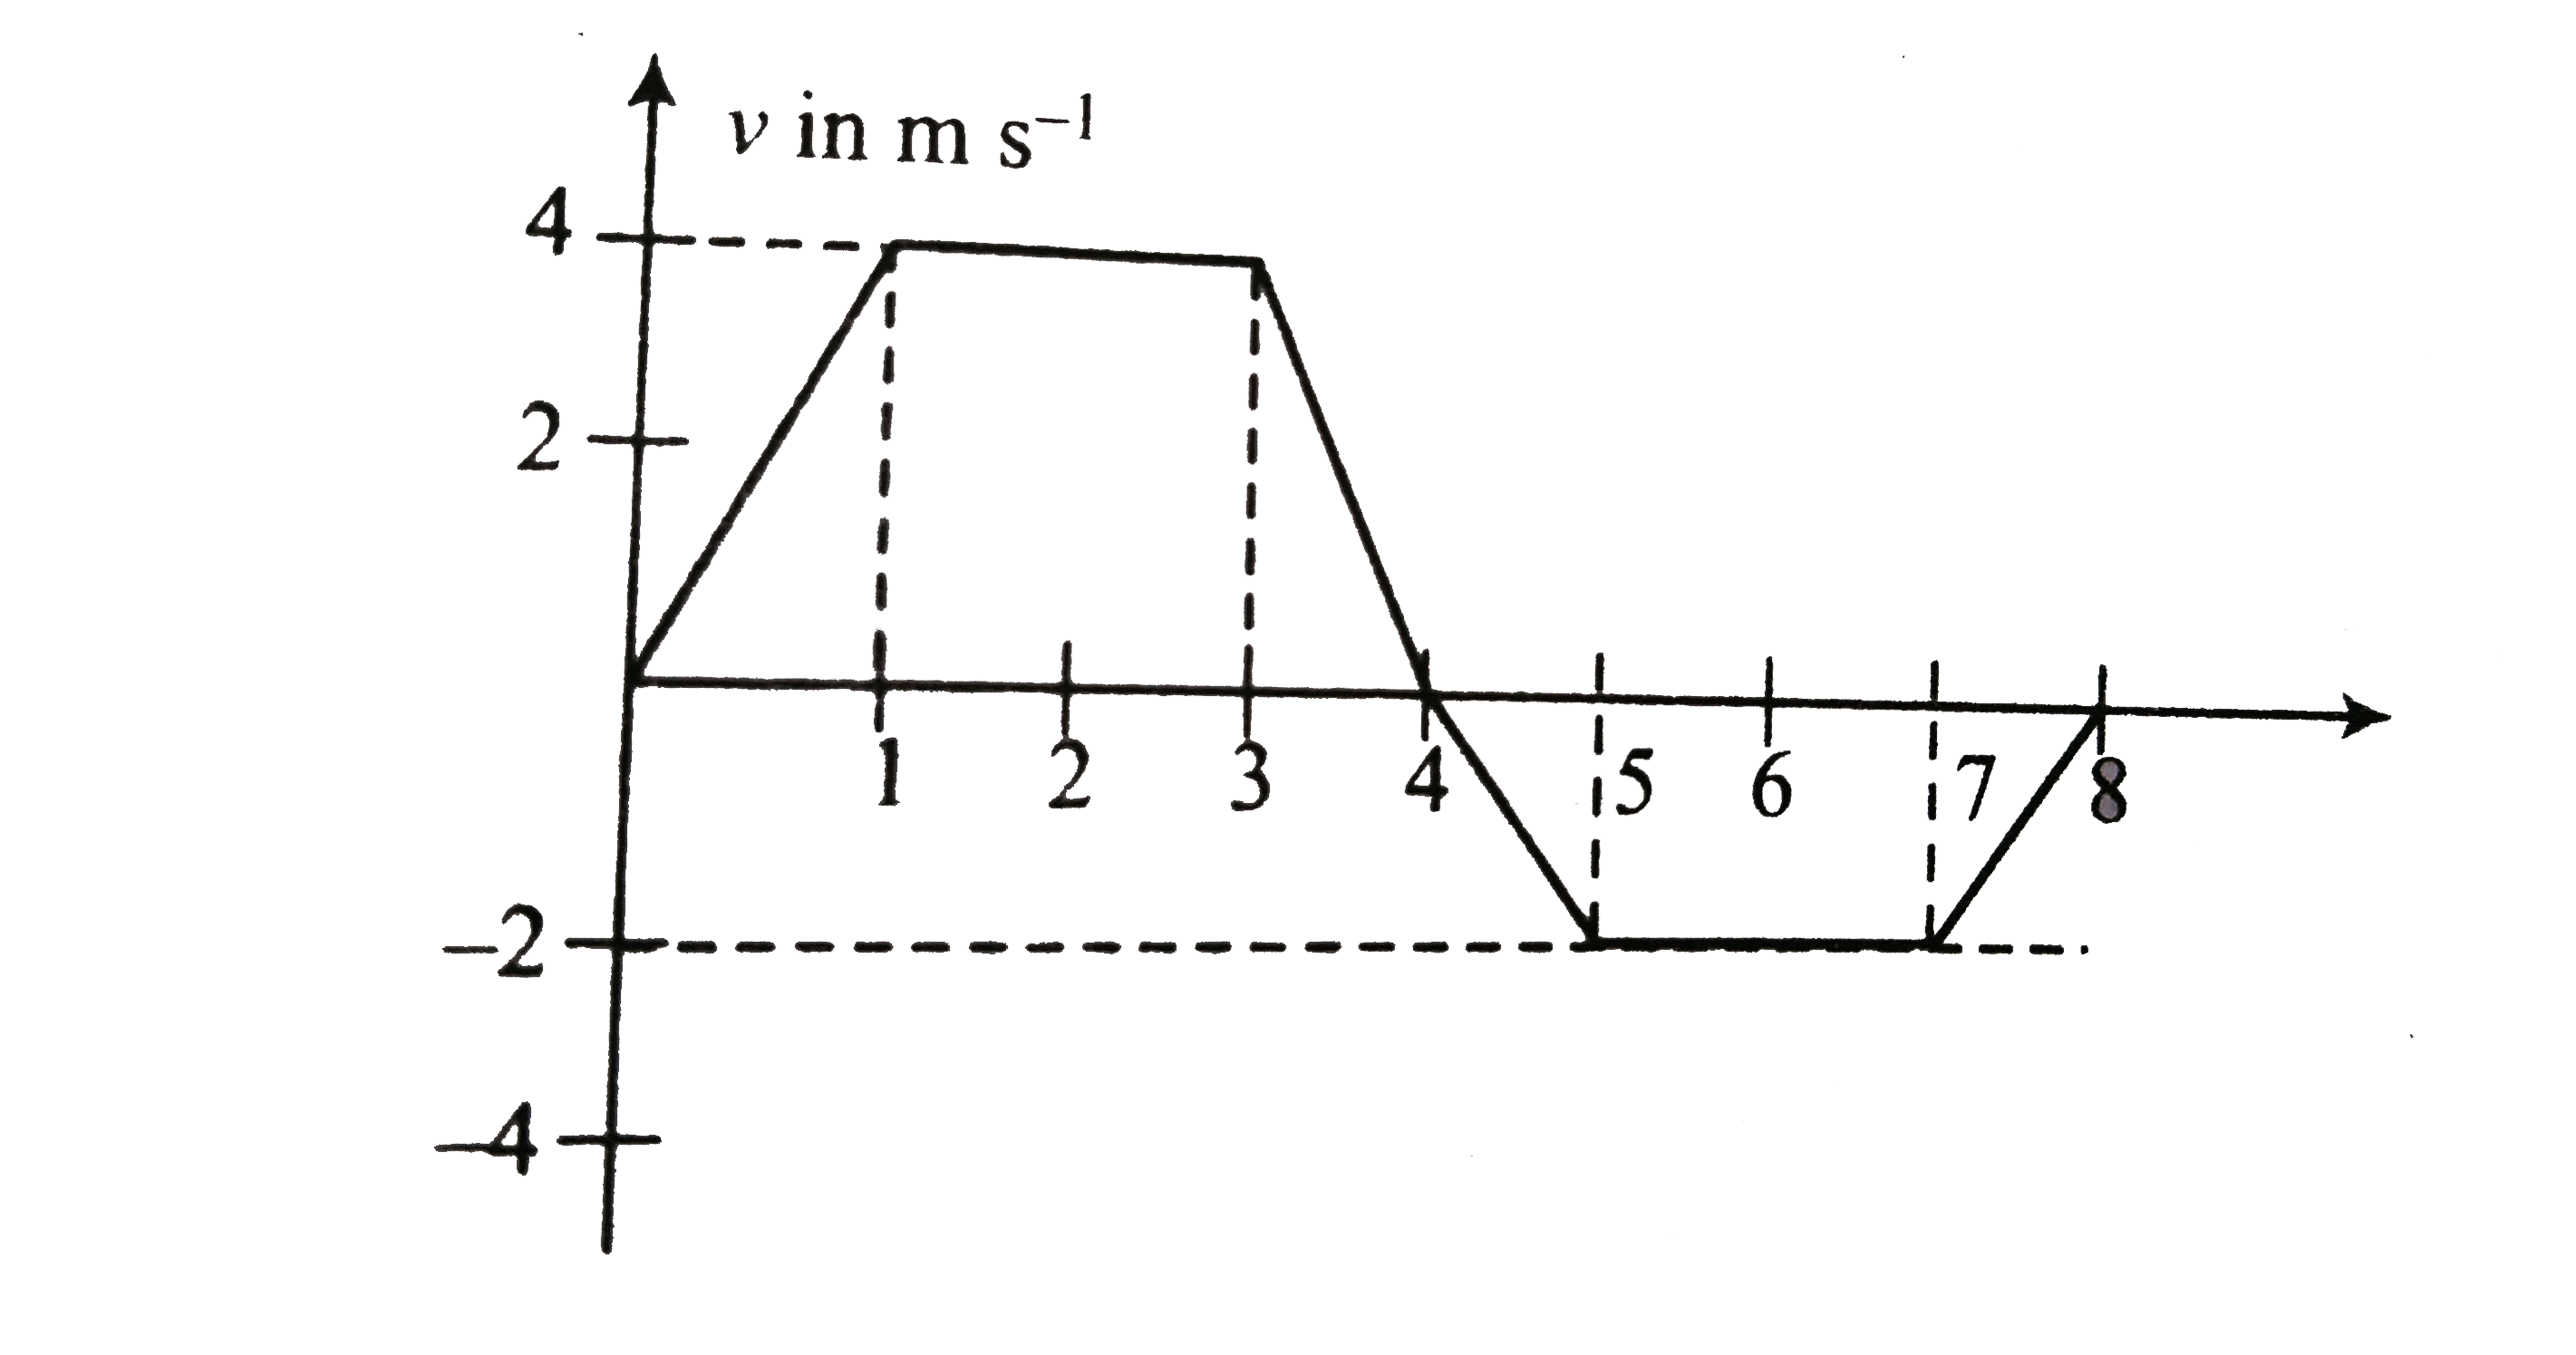 .
.
The distance of the particle from the origin after 8s is .
View Solution
