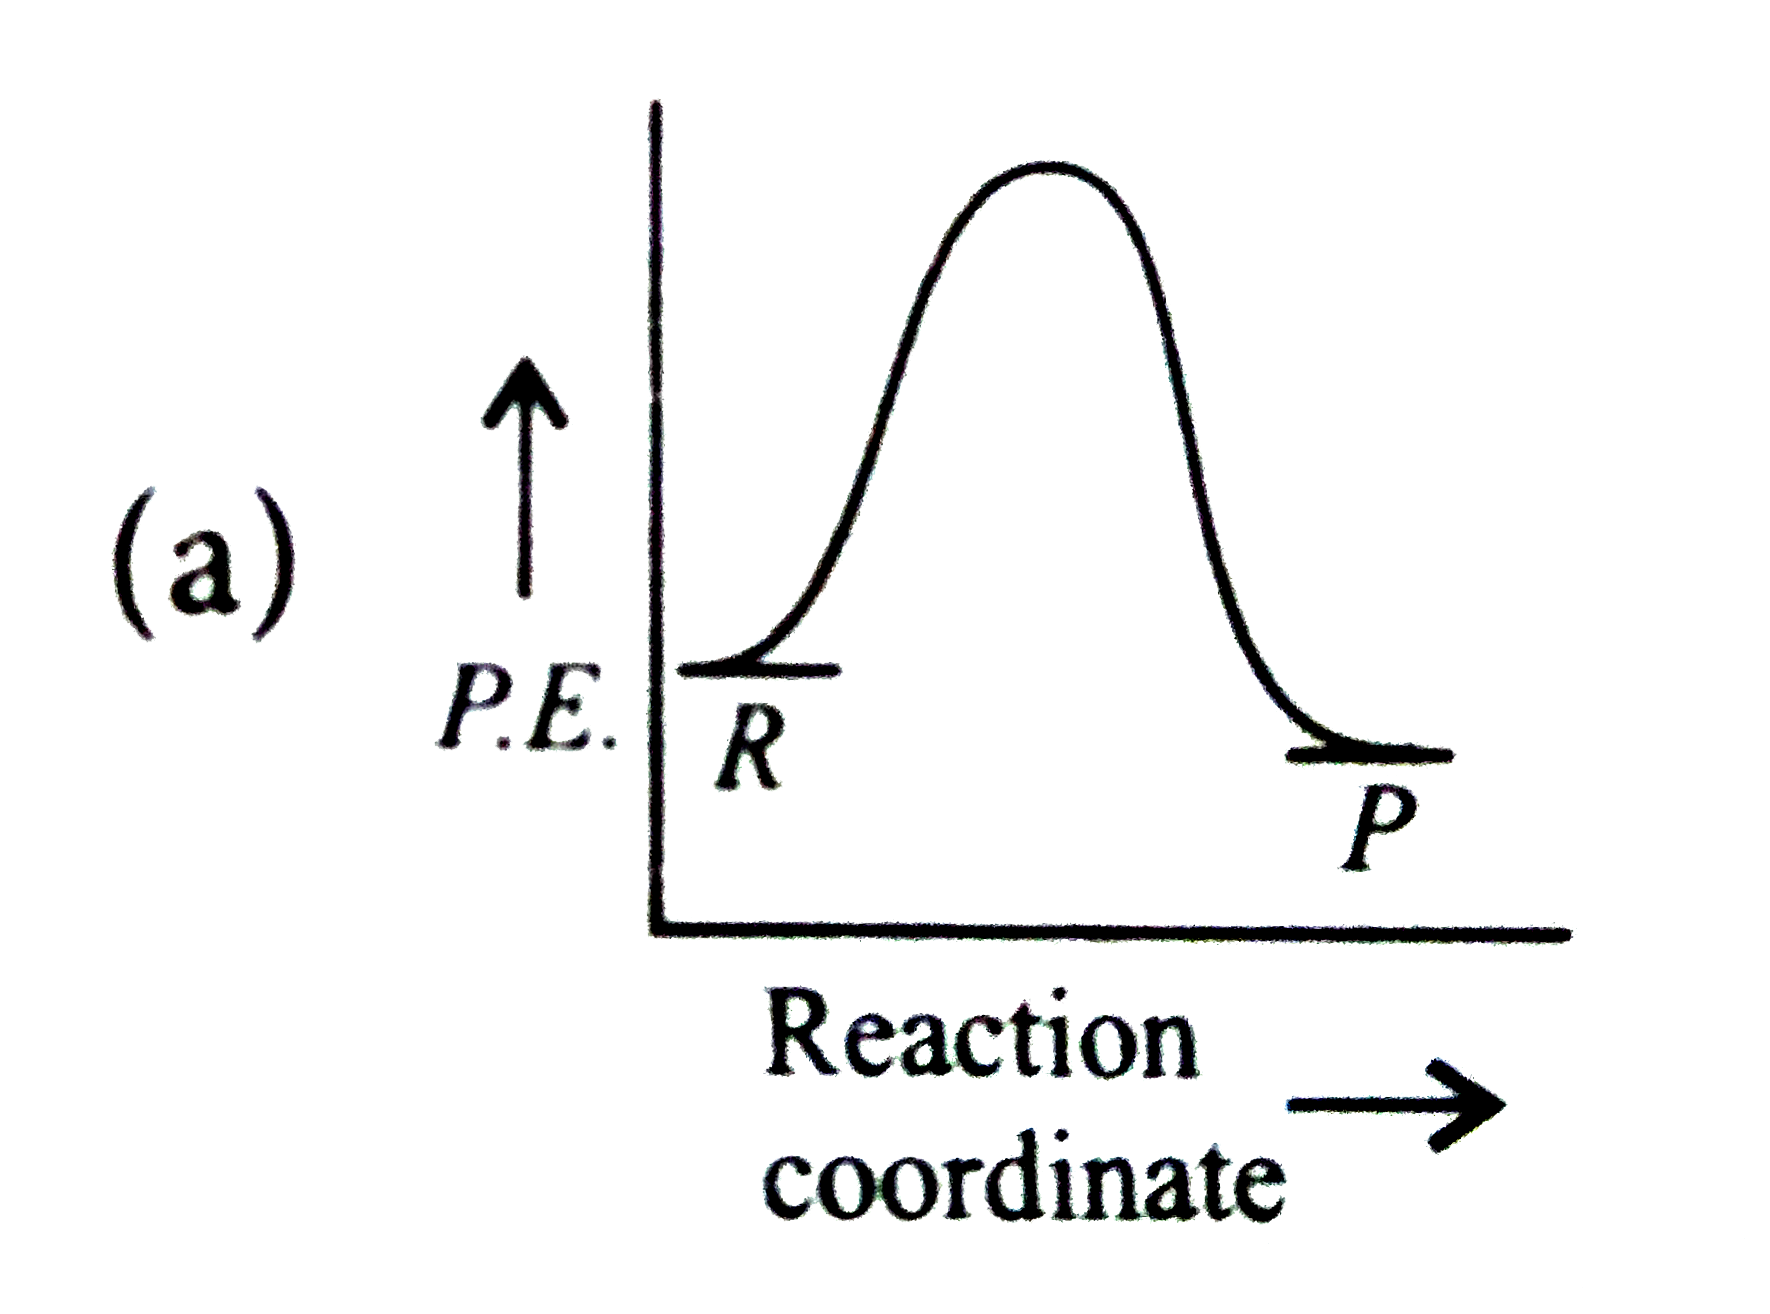
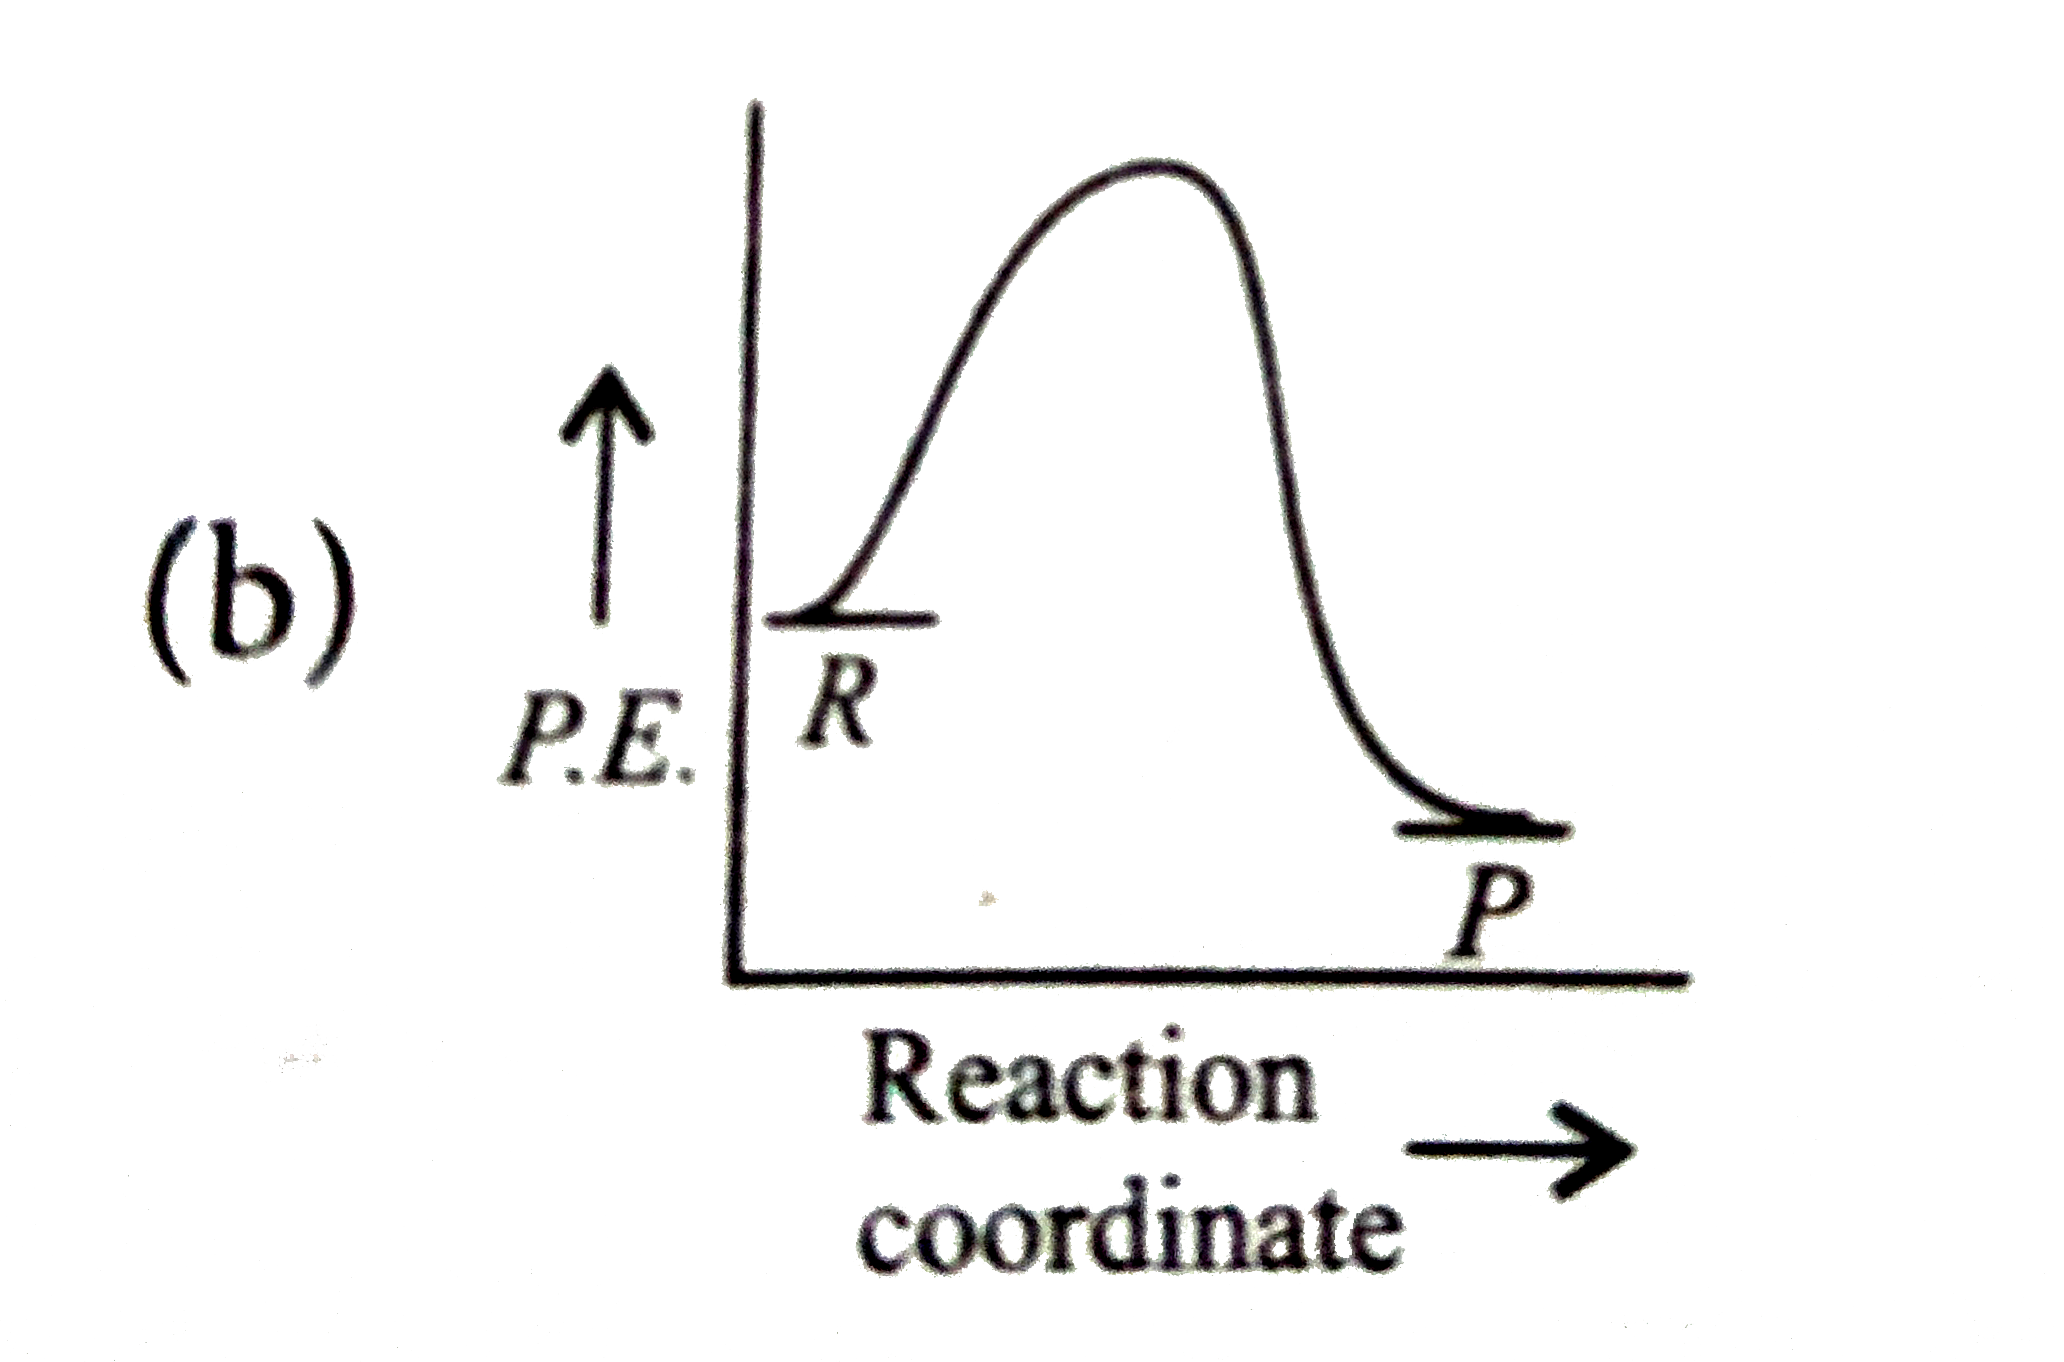
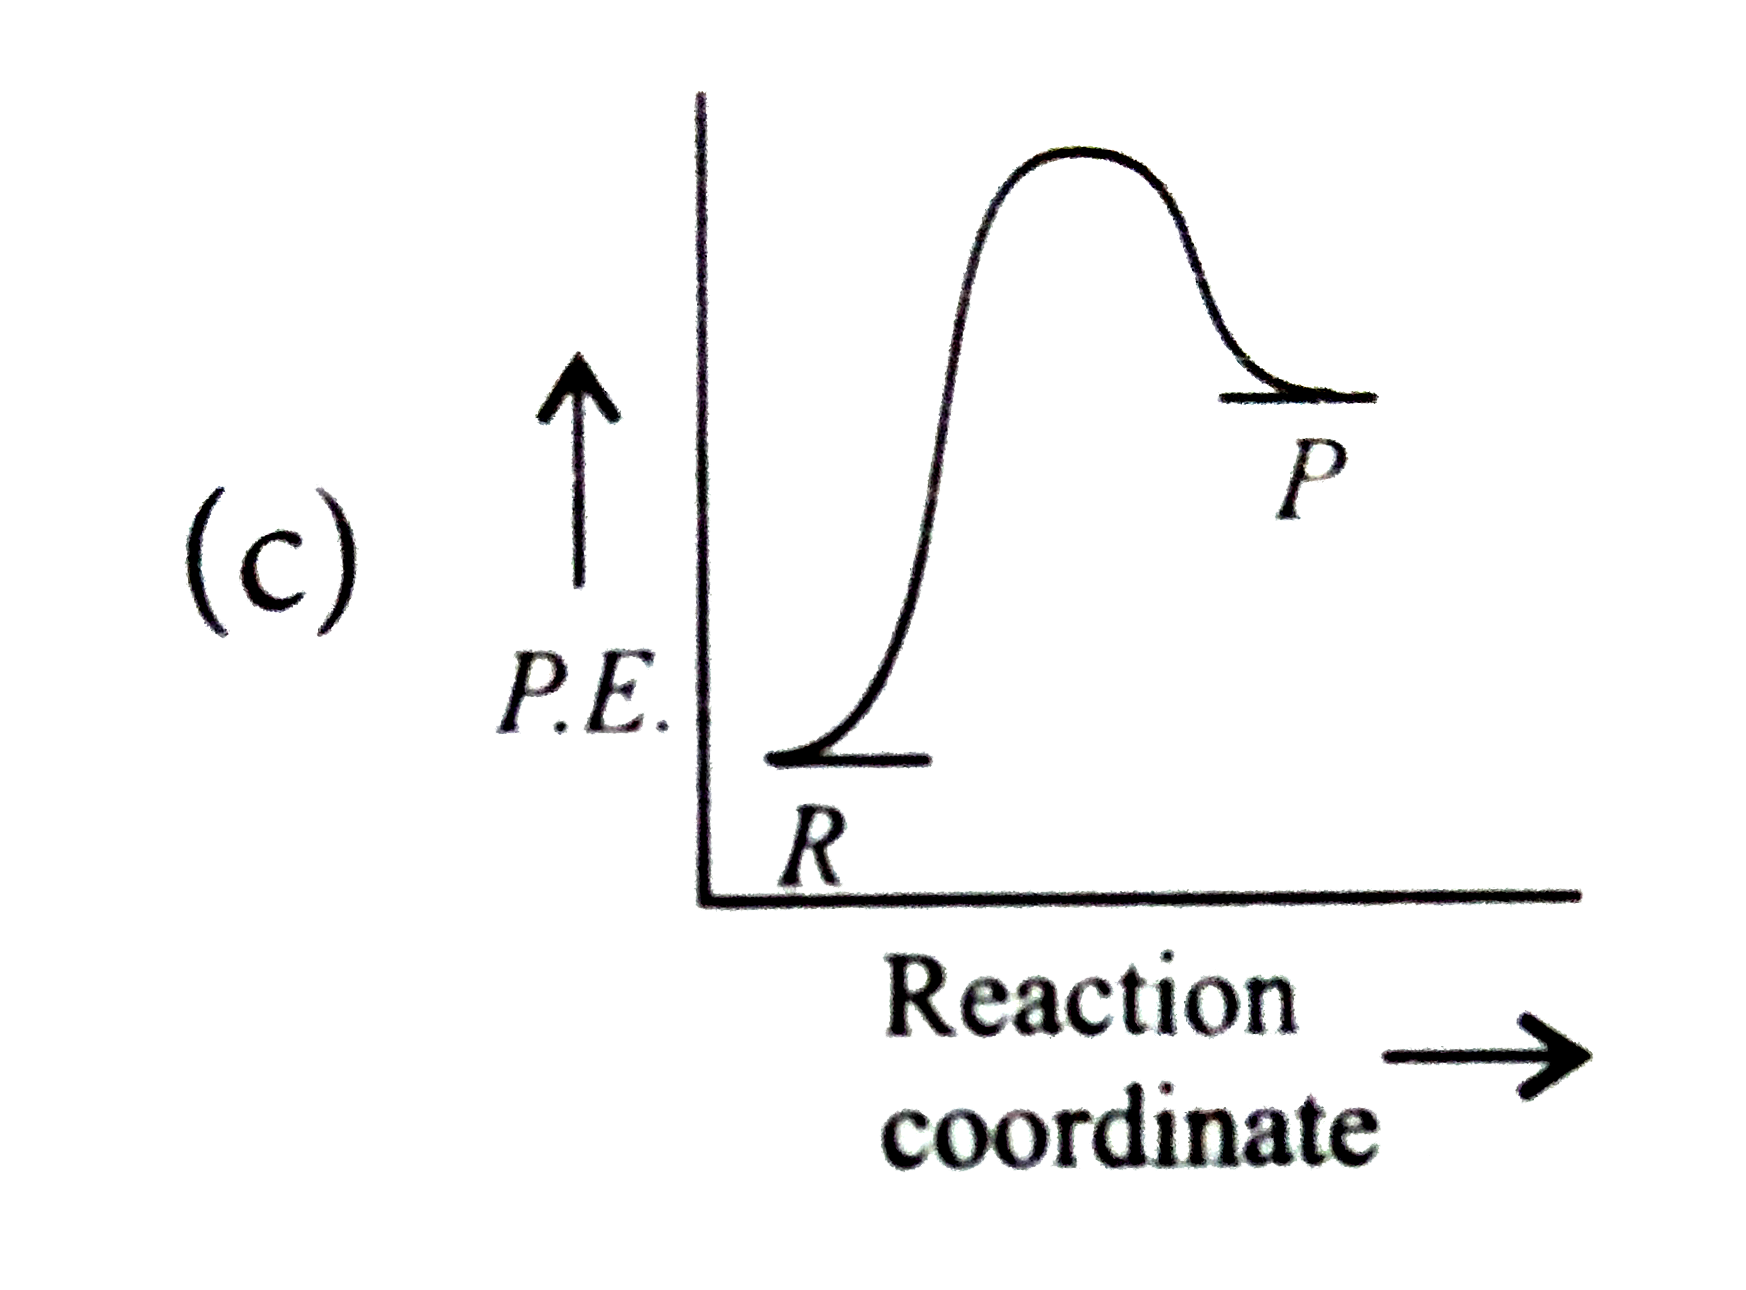
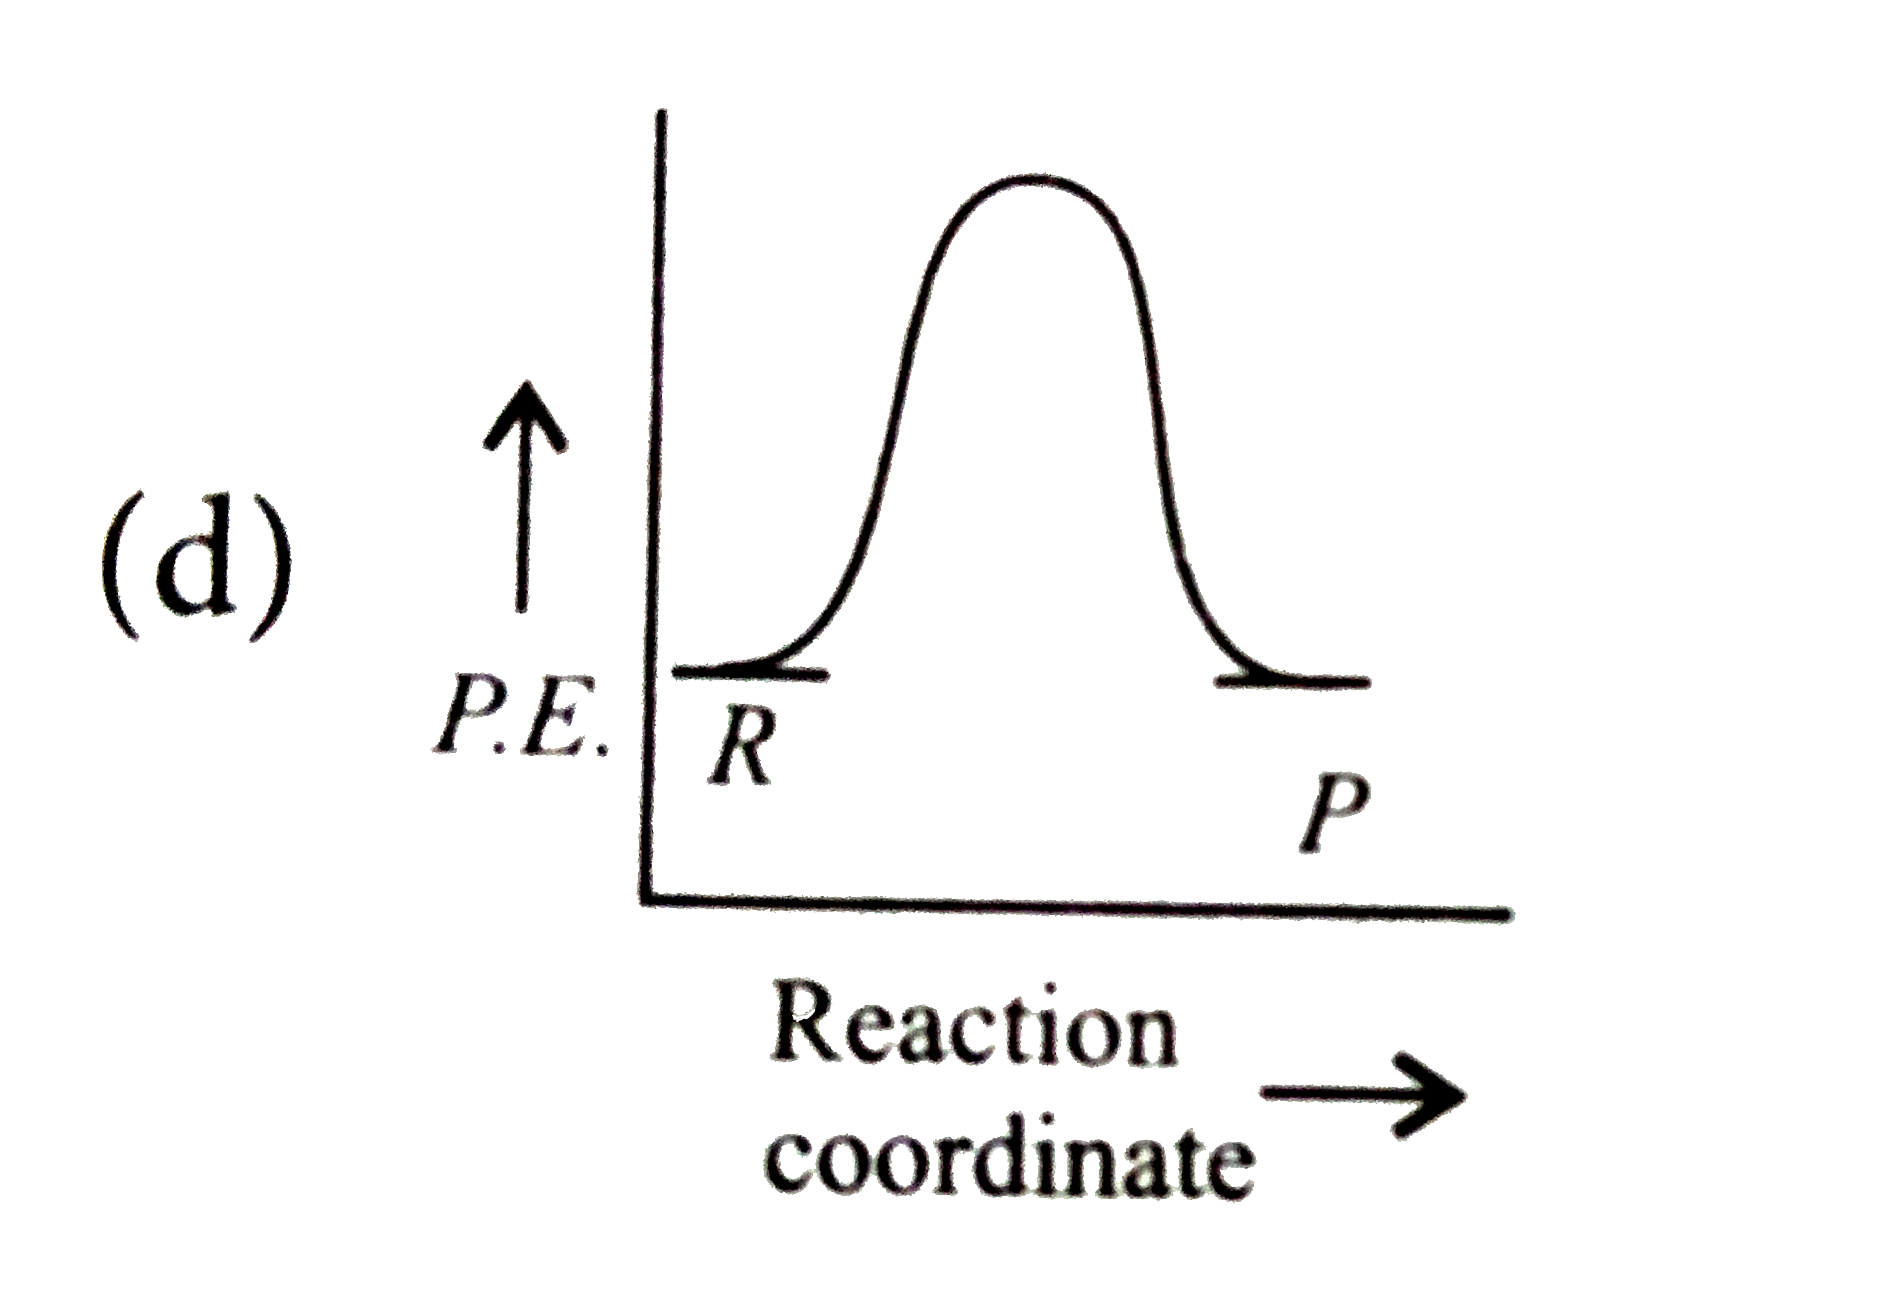
Draw a representative reaction curve for an exothermic reaction and (i) label the activation energies for the forward and reverse reaction (ii) enthalpy for the forward and reverse reactions. How will the curve change with the addition of a catalyst ?
To solve the question, we will follow these steps:
Step 1: Draw the Reaction Curve
1. Draw the axes: Start by drawing a graph with the x-axis representing the progress of the reaction and the y-axis representing the energy.
2. Plot the curve: For an exothermic reaction, draw a curve that starts at a higher energy level (reactants) and slopes down to a lower energy level (products). The curve should peak at a transition state before descending to the product level.
Step 2: Label the Activation Energies
1. Forward Activation Energy (Ea): From the reactants to the peak of the curve (transition state), label this distance as Ea (activation energy for the forward reaction).
2. Reverse Activation Energy (Ea): From the products to the peak of the curve, label this distance as E′a (activation energy for the reverse reaction).
Step 3: Label the Enthalpy Changes
1. Enthalpy of Reactants (H_R): Mark the energy level of the reactants.
2. Enthalpy of Products (H_P): Mark the energy level of the products.
3. Change in Enthalpy (ΔH): The difference in height between the reactants and products is labeled as ΔH. Since this is an exothermic reaction, ΔH will be negative, indicating that energy is released.
Step 4: Effect of a Catalyst
1. Draw the new curve with a catalyst: Draw a new curve that also starts at the reactants' energy level and ends at the products' energy level, but with a lower peak (transition state).
2. Label the new activation energies: The activation energies for both the forward and reverse reactions will be lower in the presence of a catalyst, so label these new values as E′′a and E′′a).
3. Note on Enthalpy: Indicate that the overall change in enthalpy (ΔH) remains the same despite the presence of the catalyst.
Final Diagram
Your final diagram should have:
- Two curves: one for the uncatalyzed reaction and one for the catalyzed reaction.
- Labeled activation energies for both the forward and reverse reactions.
- Labeled enthalpy levels for both reactants and products.
- An indication that the addition of a catalyst lowers the activation energy but does not change the enthalpy of the reaction.
1. Draw the axes: Start by drawing a graph with the x-axis representing the progress of the reaction and the y-axis representing the energy.
2. Plot the curve: For an exothermic reaction, draw a curve that starts at a higher energy level (reactants) and slopes down to a lower energy level (products). The curve should peak at a transition state before descending to the product level.
1. Forward Activation Energy (Ea): From the reactants to the peak of the curve (transition state), label this distance as Ea (activation energy for the forward reaction).
2. Reverse Activation Energy (Ea): From the products to the peak of the curve, label this distance as E′a (activation energy for the reverse reaction).
1. Enthalpy of Reactants (H_R): Mark the energy level of the reactants.
2. Enthalpy of Products (H_P): Mark the energy level of the products.
3. Change in Enthalpy (ΔH): The difference in height between the reactants and products is labeled as ΔH. Since this is an exothermic reaction, ΔH will be negative, indicating that energy is released.
1. Draw the new curve with a catalyst: Draw a new curve that also starts at the reactants' energy level and ends at the products' energy level, but with a lower peak (transition state).
2. Label the new activation energies: The activation energies for both the forward and reverse reactions will be lower in the presence of a catalyst, so label these new values as E′′a and E′′a).
3. Note on Enthalpy: Indicate that the overall change in enthalpy (ΔH) remains the same despite the presence of the catalyst.
Your final diagram should have:
- Two curves: one for the uncatalyzed reaction and one for the catalyzed reaction.
- Labeled activation energies for both the forward and reverse reactions.
- Labeled enthalpy levels for both reactants and products.
- An indication that the addition of a catalyst lowers the activation energy but does not change the enthalpy of the reaction.
Topper's Solved these Questions
- CHEMICAL KINETICSBOOK - ICSECHAPTER - CHEMICAL KINETICSEXERCISE - EXERCISE (PART- II (DESCRIPTIVE QUESRTIONS) C.LONG ANSWER QUESTIONS )
54 Videos
- CHEMICAL KINETICSBOOK - ICSECHAPTER - CHEMICAL KINETICSEXERCISE - ISC EXAMINATION QUESTIONS (PART-I (OBJECTIVE QUESTIONS ) A.FILL IN THE BLANKS)
12 Videos
- CHEMICAL KINETICSBOOK - ICSECHAPTER - CHEMICAL KINETICSEXERCISE - EXERCISE (PART- II (DESCRIPTIVE QUESRTIONS) A. VERY SHORT ANSWER QUESTIONS (WITH ANSWERS ))
132 Videos
- BIOMOLECULESBOOK - ICSECHAPTER - BIOMOLECULESEXERCISE - ISC EXAMINATION QUSTIONS (PART-I)(DESCRIPTIVE QUESTIONS)
21 Videos
- CHEMISTRY IN EVERYDAY LIFEBOOK - ICSECHAPTER - CHEMISTRY IN EVERYDAY LIFEEXERCISE - EXERCISE (PART - II (DESCRIPTIVE QUESTIONS) (LONG ANSWER QUESTIONS))
19 Videos
Similar Questions
Knowledge Check
An endothermic reaction with high activation energy for the forward reaction is given by the diagram
A B
B C
C D
D
A reaction having equal energies of activation for forward and reverse reactions has
View SolutionDraw the potential energy diagram for an exothermic reaction. Explain the terms:
activation energy of forward reaction
View SolutionDraw the potential energy diagram for an exothermic reaction. Explain the terms:
activation energy of backward reaction
View SolutionA reversible reaction is one which
View SolutionCatalyst makes a reaction more exothermic.
View SolutionConsider an endothermic reaction X→Y with the activation energies Eb and Ef for the backward and forward reaction, respectively. In general
View SolutionWhich are correct for a reversible reaction
View Solution
