The experimental data for decomposition of
N2O5[2N2O5→4NO2+O2]
in gas phase at 318 K are given below:
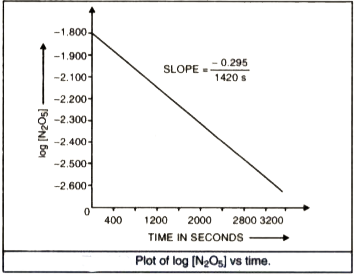
(##KALKLCISCCHEXIIC04SLV027_Q01.png width=80%><br>Drawagraphbetweenlog [N_2 O_5] and t .
To plot graph between log [N2O5] versus time, given data is tabulated as shown below and the graph obtained is shown in Fig.

Topper's Solved these Questions
- CHEMICAL KINETICSBOOK - ICSECHAPTER - CHEMICAL KINETICSEXERCISE - PROBLEM
165 Videos
- CHEMICAL KINETICSBOOK - ICSECHAPTER - CHEMICAL KINETICSEXERCISE - INTEXT QUESRTIONS
81 Videos
- BIOMOLECULESBOOK - ICSECHAPTER - BIOMOLECULESEXERCISE - ISC EXAMINATION QUSTIONS (PART-I)(DESCRIPTIVE QUESTIONS)
21 Videos
- CHEMISTRY IN EVERYDAY LIFEBOOK - ICSECHAPTER - CHEMISTRY IN EVERYDAY LIFEEXERCISE - EXERCISE (PART - II (DESCRIPTIVE QUESTIONS) (LONG ANSWER QUESTIONS))
19 Videos
Similar Questions
The experimental data for decomposition of
N2O5[2N2O5→4NO2+O2]
in gas phase at 318 K are given below:
(##KAL_KLC_ISC_CHE_XII_C04_SLV_028_Q01.png" width="80%">
What is rate law?
View SolutionThe experimental data for decomposition of
N2O5[2N2O5→4NO2+O2]
in gas phase at 318 K are given below:
(##KAL_KLC_ISC_CHE_XII_C04_SLV_028_Q01.png" width="80%">
What is rate law?
View SolutionThe experimental data for decomposition of
N2O5[2N2O5→4NO2+O2]
in gas phase at 318 K are given below:
(##KAL_KLC_ISC_CHE_XII_C04_SLV_028_Q01.png" width="80%">
What is rate law?
View SolutionThe experimental data for decomposition of
N2O5[2N2O5→4NO2+O2]
in gas phase at 318 K are given below:
(##KALKLCISCCHEXIIC04SLV025_Q01.png width=80%><br>Plot[N_2 O_5] against
View SolutionThe experimental data for decomposition of
N2O5[2N2O5→4NO2+O2]
in gas phase at 318 K are given below:
(##KALKLCISCCHEXIIC04SLV025_Q01.png width=80%><br>Plot[N_2 O_5] against
View SolutionThe experimental data for decomposition of
N2O5[2N2O5→4NO2+O2]
in gas phase at 318 K are given below:
(##KALKLCISCCHEXIIC04SLV025_Q01.png width=80%><br>Plot[N_2 O_5] against
View SolutionThe experimental data for decomposition of
N2O5[2N2O5→4NO2+O2]
in gas phase at 318 K are given below:
(##KAL_KLC_ISC_CHE_XII_C04_SLV_029_Q01.png" width="80%">
Calculate the rate constant.
View SolutionThe experimental data for decomposition of
N2O5[2N2O5→4NO2+O2]
in gas phase at 318 K are given below:
(##KAL_KLC_ISC_CHE_XII_C04_SLV_029_Q01.png" width="80%">
Calculate the rate constant.
View SolutionThe experimental data for decomposition of
N2O5[2N2O5→4NO2+O2]
in gas phase at 318 K are given below:
(##KAL_KLC_ISC_CHE_XII_C04_SLV_029_Q01.png" width="80%">
Calculate the rate constant.
View SolutionThe experimental data for decomposition of
N2O5[2N2O5→4NO2+O2]
in gas phase at 318 K are given below:
(##KAL_KLC_ISC_CHE_XII_C04_SLV_026_Q01.png" width="80%">
Find the half-life period for the reaction
View Solution
