In statistics, the bar graph of a frequency distribution is called
A
histogram
B
frequency polygon
C
cumulative frequency
D
graph
Video Solution
Text Solution
The correct Answer is:A
Histogram is the bar graph of a frequency distribution. It shows the distribution of all observations in a quantitative data set.
|
Similar Questions
Knowledge Check
A graph of cummulative frequency distribution is called
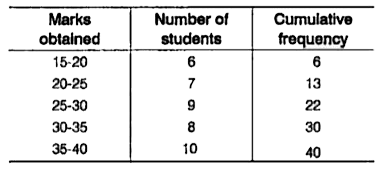
AOgiveBHistogramCHistorigramDFrequency PolygonThe median of the frequency distribution is
 A28.88B30.88C35.88DNone of these
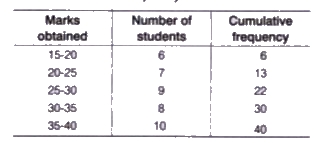
The median of the frequency distribution is
 A28.88B30.88C35.88DNone of these


