Directions for questions : These questions are based on the following data. Read the following bar graph and answer the questions.
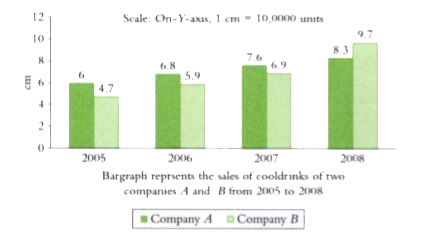
Find the maximum difference between the sales of A and sales of B in any year in the given period.
170000
140000
50000
300000
The correct Answer is:B
Step by step video & image solution for Directions for questions : These questions are based on the following data. Read the following bar graph and answer the questions. Find the maximum difference between the sales of A and sales of B in any year in the given period. by Maths experts to help you in doubts & scoring excellent marks in Class 7 exams.
Updated on:21/07/2023Topper's Solved these Questions
- STATISTICSBOOK - PEARSON IIT JEE FOUNDATIONCHAPTER - STATISTICSEXERCISE - CONCEPT APPLICATION (LEVEL 2)
22 Videos
- STATISTICSBOOK - PEARSON IIT JEE FOUNDATIONCHAPTER - STATISTICSEXERCISE - CONCEPT APPLICATION (LEVEL 3)
11 Videos
- STATISTICSBOOK - PEARSON IIT JEE FOUNDATIONCHAPTER - STATISTICSEXERCISE - TEST YOUR CONCEPTS (Essay Type Questions)
3 Videos
- SIMPLE INTEREST AND COMPOUND INTEREST BOOK - PEARSON IIT JEE FOUNDATIONCHAPTER - SIMPLE INTEREST AND COMPOUND INTEREST EXERCISE - Level 3
9 Videos
Similar Questions
Directions for questions : These questions are based on the following data. Read the following bar graph and answer the questions.
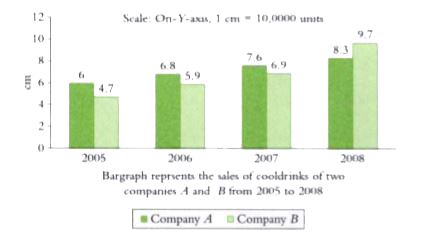
In year 2007 what is the difference between the sales of A and the sales of B ?
View SolutionDirections for questions : These questions are based on the following data. Read the following bar graph and answer the questions.
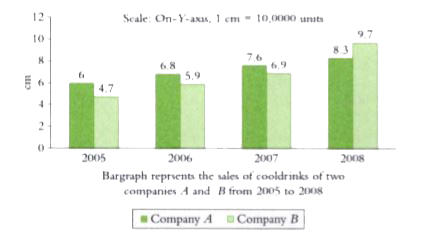
In which year is the sales of B more than the sales of A?
View Solution
Knowledge Check
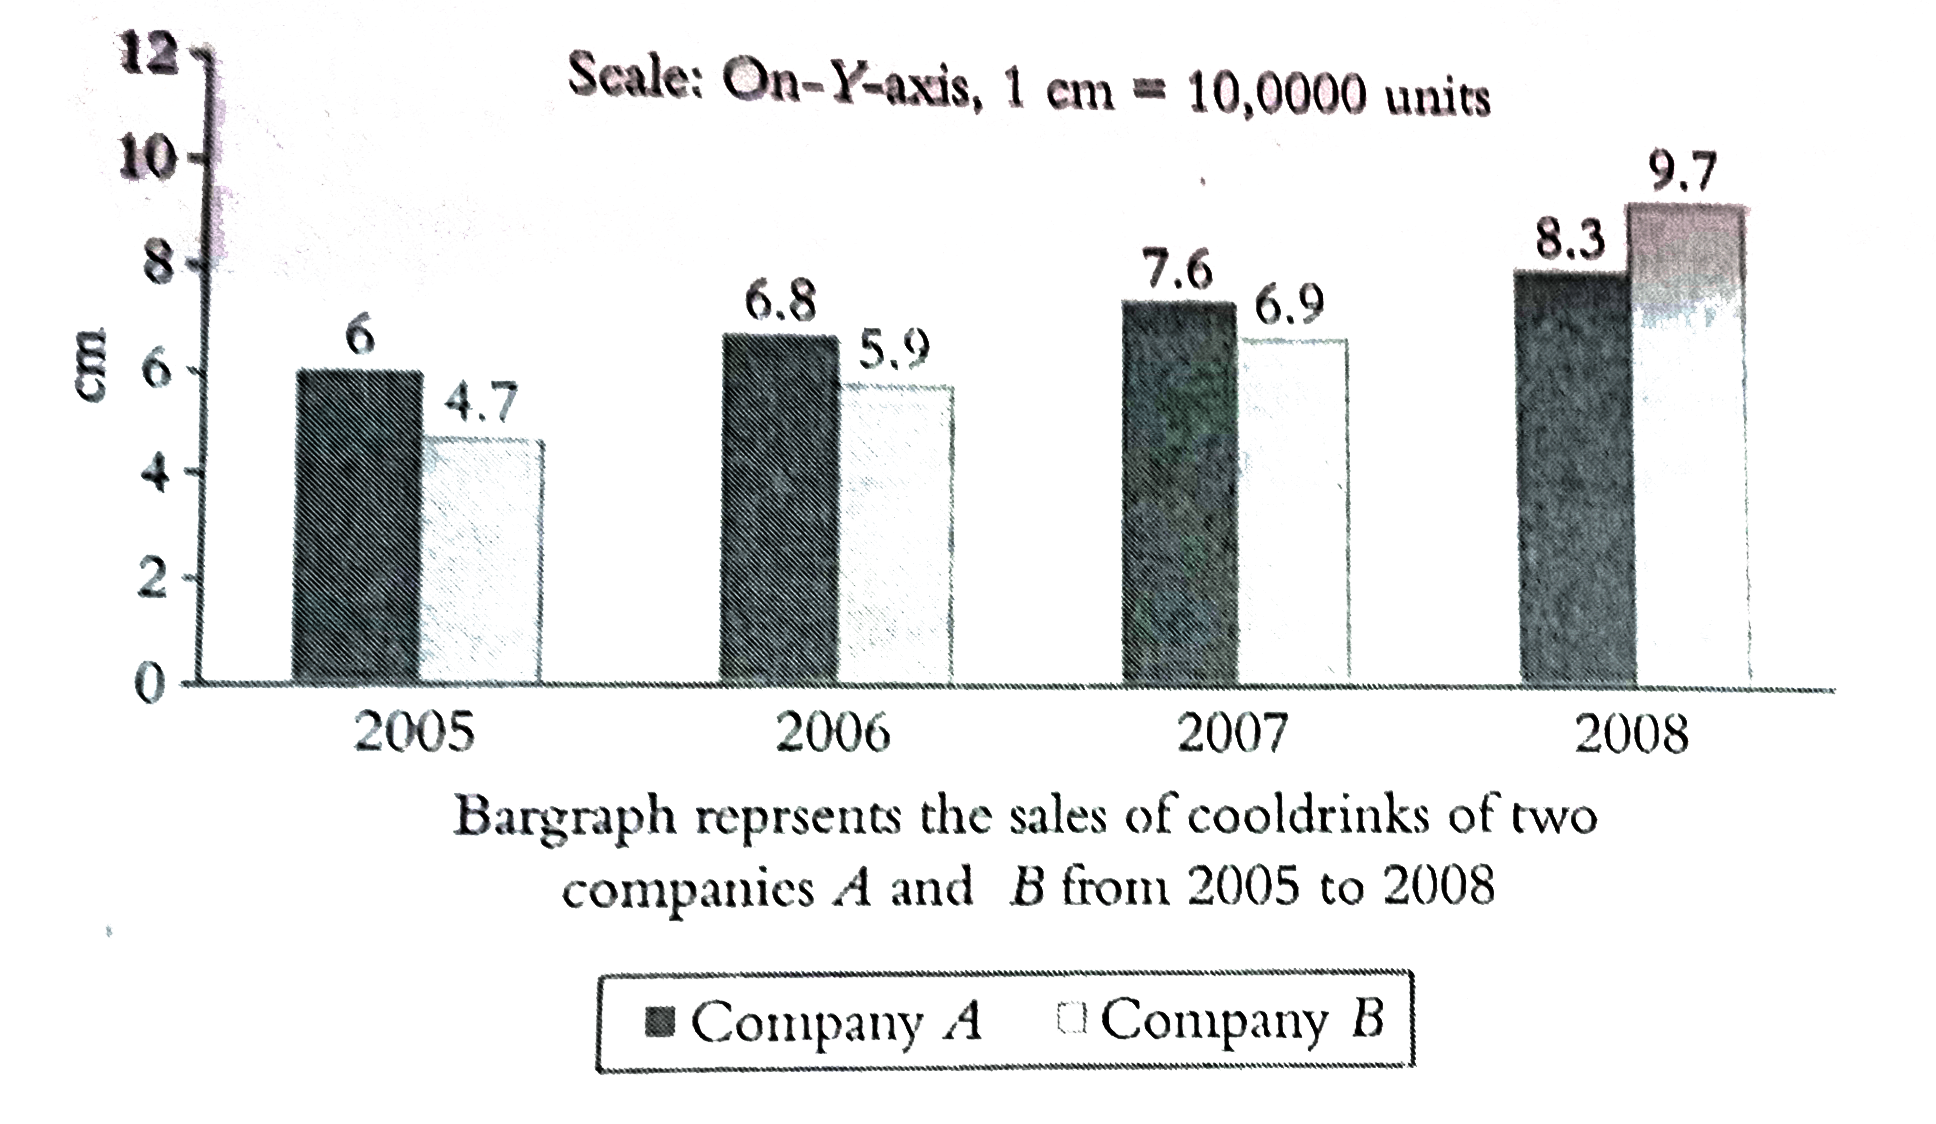
Find the minimum difference between the sales of A and sales of B in any year in the given period.A90000B70000C50000D30000Directions for questions : These questions are based on the following data. Read the following bar graph and answer the following.
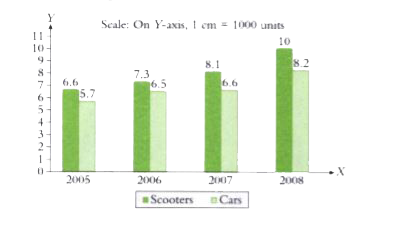
Find the maximum difference between sales of scooters and that of cars, in any year, in the given period.A1500B1700C1800D2000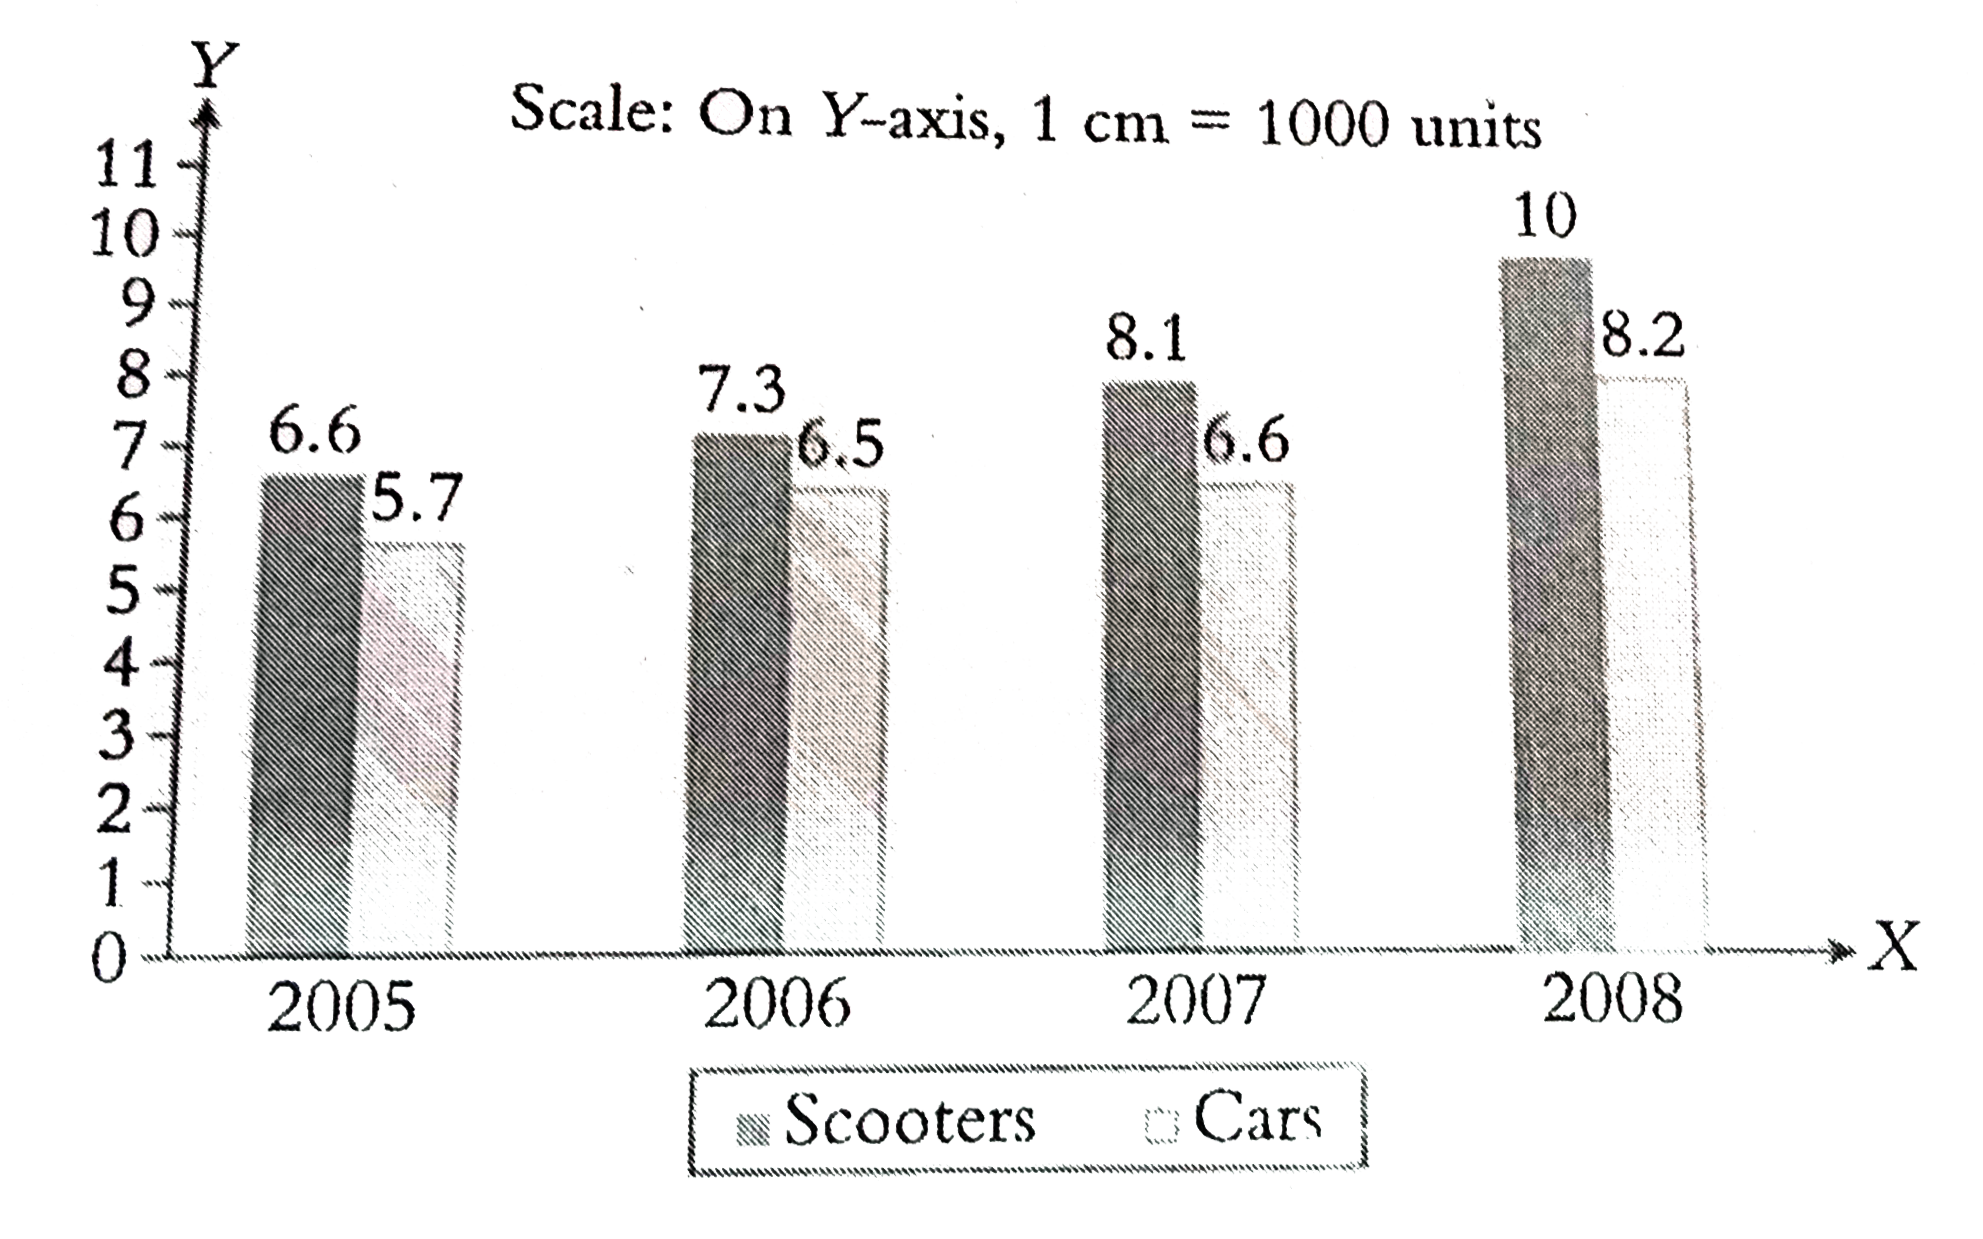
Find the maximum difference between sales of scooters and that of cars, in ant year, in the given period.A1500B1700C1800D2000
Directions for questions : These questions are based on the following data. Read the following bar graph and answer the questions.
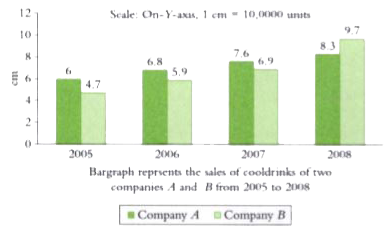
Find the ratio of the total sales in the year 2007 and that in 2008.
View SolutionDirections for questions : These questions are based on the following data. Read the following bar graph and answer the questions.
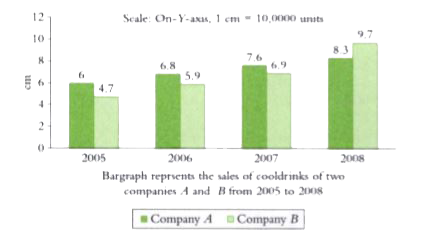
Total sales of A and B in the year 2006 is ______ .
View SolutionDirections for questions : These questions are based on the following data. Read the following bar graph and answer the following.
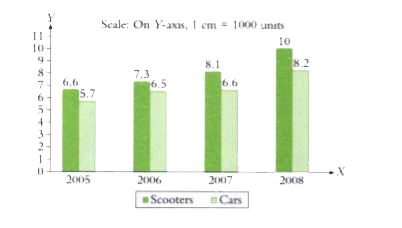
In which year is the difference between the sales of the scooters and the sales of cars the least?
View SolutionDirections for questions : These questions are based on the following data. Read the following bar graph and answer the following.
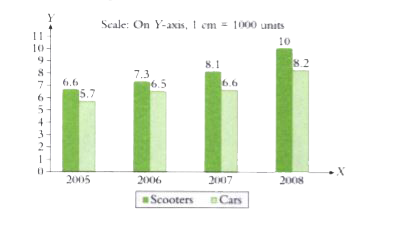
Find the total number of scooters sold in the four years.
View SolutionDirections for questions : These questions are based on the following data. Read the following bar graph and answer the following.
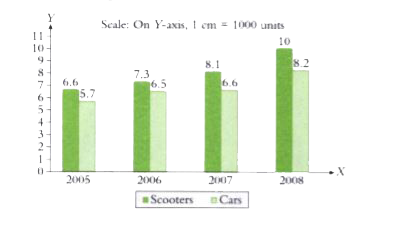
Find the ratio between the total number of vehicles sold (scooters and cars) in the year 2006 and that in the year 2008.
View Solution
