When the product of pressure and volume is plotted against pressure for a given amount of gas, the line obtained is
parallel of X-axis
parallel to Y-axis
linear with positive slope
linear with negative slope
The correct Answer is:A
To solve the question, we need to analyze the relationship between pressure (P), volume (V), and the product of pressure and volume (PV) for a given amount of gas, particularly under constant temperature conditions.
1. Understand Boyle's Law:
- Boyle's Law states that for a given amount of gas at constant temperature, the pressure (P) of the gas is inversely proportional to its volume (V). This can be mathematically expressed as:
PV=k
where k is a constant.
2. Express the Product of Pressure and Volume:
- From Boyle's Law, we know that the product PV is constant. Therefore, we can denote this constant as C:
PV=C
3. Plotting the Graph:
- The question asks us to plot the product PV against pressure P. Since PV is constant, we can express this as:
PV=C⟹V=CP
- When we plot PV on the y-axis and P on the x-axis, we see that PV remains constant regardless of the changes in P.
4. Determine the Nature of the Graph:
- Since PV is constant, the graph of PV versus P will be a horizontal line (constant value) parallel to the x-axis. This indicates that as pressure changes, the product PV does not change.
5. Conclusion:
- Therefore, the line obtained when plotting the product of pressure and volume against pressure for a given amount of gas is a horizontal line parallel to the x-axis.
Final Answer:
The line obtained is parallel to the x-axis.
- Boyle's Law states that for a given amount of gas at constant temperature, the pressure (P) of the gas is inversely proportional to its volume (V). This can be mathematically expressed as:
PV=k
where k is a constant.
- From Boyle's Law, we know that the product PV is constant. Therefore, we can denote this constant as C:
PV=C
- The question asks us to plot the product PV against pressure P. Since PV is constant, we can express this as:
PV=C⟹V=CP
- When we plot PV on the y-axis and P on the x-axis, we see that PV remains constant regardless of the changes in P.
- Since PV is constant, the graph of PV versus P will be a horizontal line (constant value) parallel to the x-axis. This indicates that as pressure changes, the product PV does not change.
- Therefore, the line obtained when plotting the product of pressure and volume against pressure for a given amount of gas is a horizontal line parallel to the x-axis.
The line obtained is parallel to the x-axis.
Similar Questions
Out of the three states of matter, only the gases have most of the physical properties common. They neither have definite shapes nor volumes. Upon mixing they form homogeneous mixture irrespective of their nature and can also be compressed on applying pressure. In addition to these, the gases obey different gas laws such as boyle's Law, Charles's Law, Dalton's Law of partial pressures, Graham's Law of diffusion etc. Based upon these laws, ideal gas equation PV=nRT has been derived.
When the product of pressure and volume is plotted against pressure for a given amount of a gas, the obtained is
View SolutionAt constant temperature, the product of pressure and volume of a given amount of a gas is constant. This is :
View SolutionIn an adiabatic expansion the product of pressure and volume :
View SolutionAt a given volume and temperature the pressure of a gas
View SolutionWhich of the following shows correct relation between volume and temperature at constant pressure for a given amount of gas
View SolutionWhen pH or temperature is plotted against enzyme activity the shape of curve obtained is
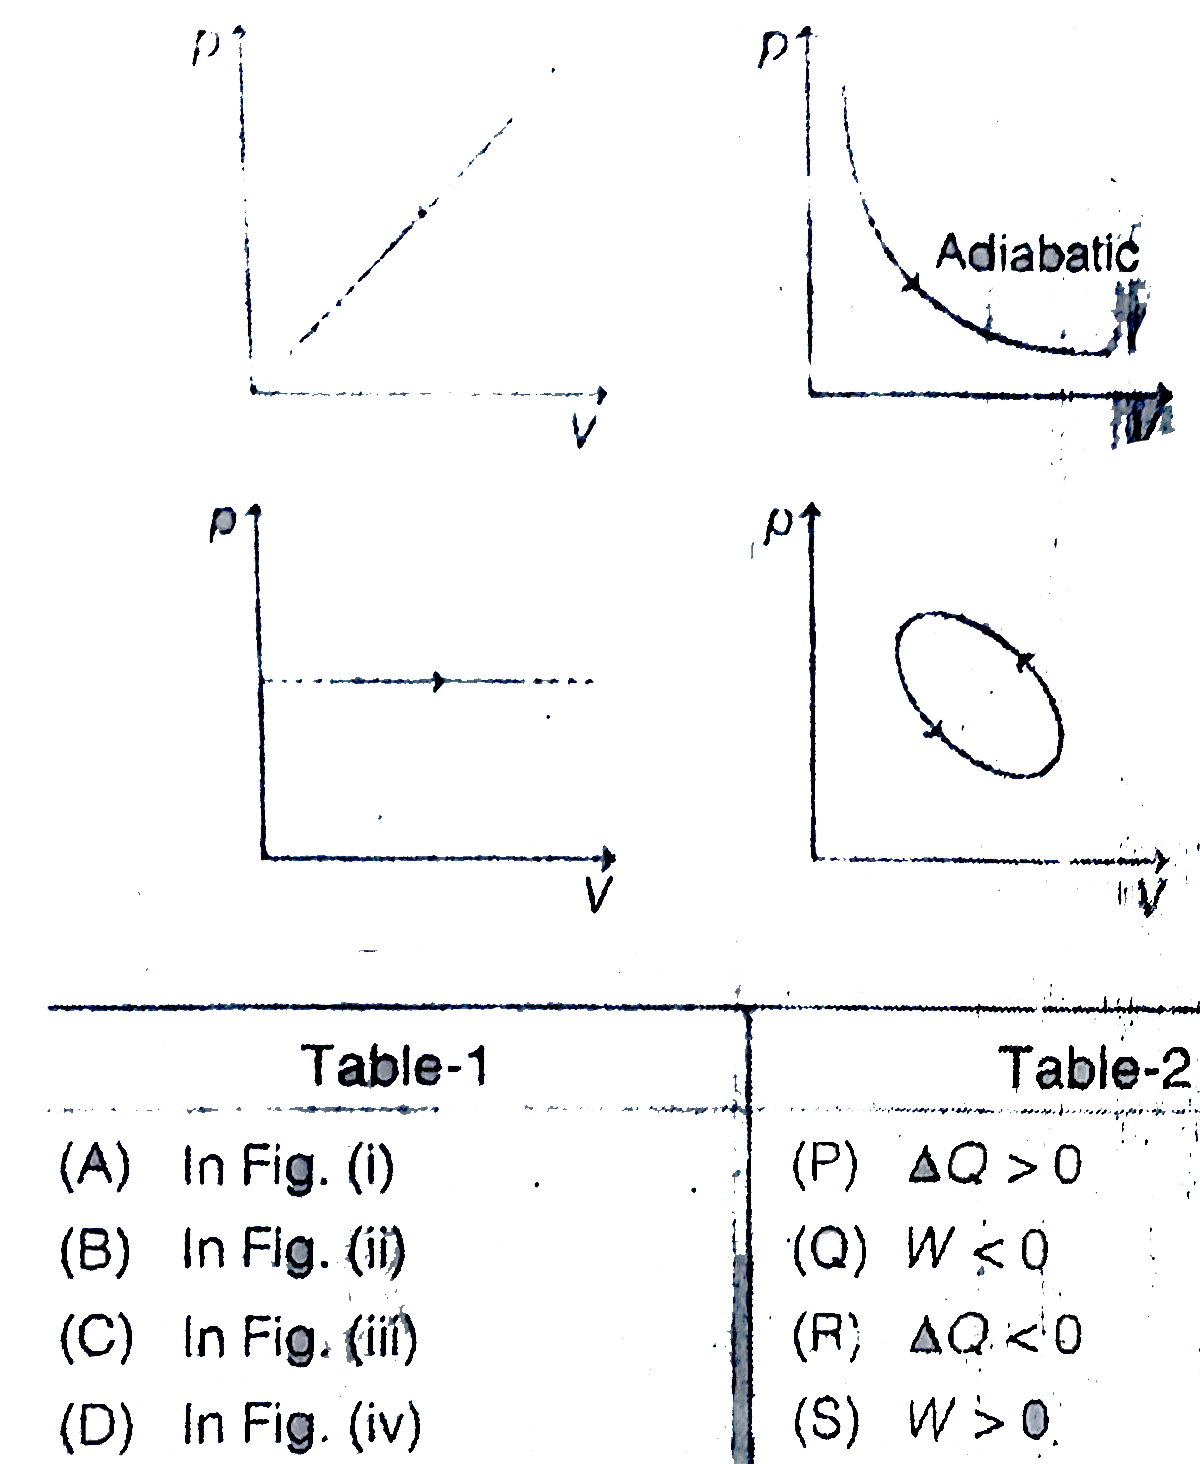
View SolutionThe figures given below show different processes (relating pressure P and volume V) for a given amount of an ideal gas. W is work done by the gas and ΔQ is heat absorbed by the gas.

View SolutionKE per unit volume is E. The pressure exerted by the gas is given by
View SolutionAt constant temperature, the effect of change of pressure on volume of a gas was as given below

Plot the following graphs :
PV vs P.
View SolutionAt constant temperature, the effect of change of pressure on volume of a gas was as given below

Plot the following graphs :
P vs V
View Solution
