Index of energy consumption is maximum for
U.S.A
japan
norway
canada
The correct Answer is:D
To solve the question regarding which country has the maximum index of energy consumption, we can follow these steps:
Step 1: Identify the Countries and Their Energy Consumption Values
We need to gather the energy consumption values for the countries mentioned in the question. According to the video transcript, the following values are provided:
- USA: 6917 kWh
- Japan: 3470 kWh
- Norway: 5854 kWh
- Another country (not specified in the transcript): 7247 kWh
Step 2: Compare the Energy Consumption Values
Next, we will compare the energy consumption values to determine which one is the highest:
- USA: 6917 kWh
- Japan: 3470 kWh
- Norway: 5854 kWh
- Another country: 7247 kWh
Step 3: Identify the Maximum Value
From the comparison, we can see that:
- 6917 kWh (USA) is less than 7247 kWh (the unspecified country).
- 3470 kWh (Japan) is the lowest.
- 5854 kWh (Norway) is also lower than 6917 kWh.
Step 4: Conclusion
The maximum energy consumption index is 7247 kWh, which corresponds to the unspecified country. Therefore, the answer to the question is that the index of energy consumption is maximum for the country with 7247 kWh.
Final Answer
The country with the maximum index of energy consumption is the one with 7247 kWh.
---
We need to gather the energy consumption values for the countries mentioned in the question. According to the video transcript, the following values are provided:
- Japan: 3470 kWh
- Norway: 5854 kWh
- Another country (not specified in the transcript): 7247 kWh
Next, we will compare the energy consumption values to determine which one is the highest:
- Japan: 3470 kWh
- Norway: 5854 kWh
- Another country: 7247 kWh
From the comparison, we can see that:
- 6917 kWh (USA) is less than 7247 kWh (the unspecified country).
- 3470 kWh (Japan) is the lowest.
- 5854 kWh (Norway) is also lower than 6917 kWh.
The maximum energy consumption index is 7247 kWh, which corresponds to the unspecified country. Therefore, the answer to the question is that the index of energy consumption is maximum for the country with 7247 kWh.
The country with the maximum index of energy consumption is the one with 7247 kWh.
Topper's Solved these Questions
- ENVIRONMENTAL ISSUESBOOK - DINESH PUBLICATION ENGLISHCHAPTER - ENVIRONMENTAL ISSUESEXERCISE - Assertion and reason
246 Videos
- ENVIRONMENTAL ISSUESBOOK - DINESH PUBLICATION ENGLISHCHAPTER - ENVIRONMENTAL ISSUESEXERCISE - Model test paper-1
100 Videos
- ENVIRONMENTAL ISSUESBOOK - DINESH PUBLICATION ENGLISHCHAPTER - ENVIRONMENTAL ISSUESEXERCISE - Check your grasp
18 Videos
- ECHINODERMATABOOK - DINESH PUBLICATION ENGLISHCHAPTER - ECHINODERMATAEXERCISE - REVISION QUESTIONS
65 Videos
- EVIDENCES OF EVOLUTIONBOOK - DINESH PUBLICATION ENGLISHCHAPTER - EVIDENCES OF EVOLUTIONEXERCISE - CHECK YOUR GRASP
19 Videos
Similar Questions
Knowledge Check

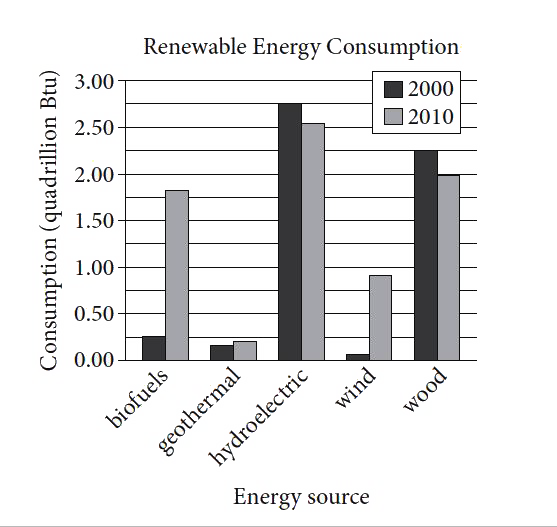
The bar graph above shows renewable energy consumption in quadrillions of British thermal units (Btu) in the United States, by energy source, for several energy sources in the years 2000 and 2010.
In a scatterplot of this data, where renewable energy consumption in the year 2000 is plotted along the x-axis and renewable energy consumption in the year 2010 is plotted along the y-axis for each of the given energy sources, how many data points would be above the line y=x ?A1B2C3D4
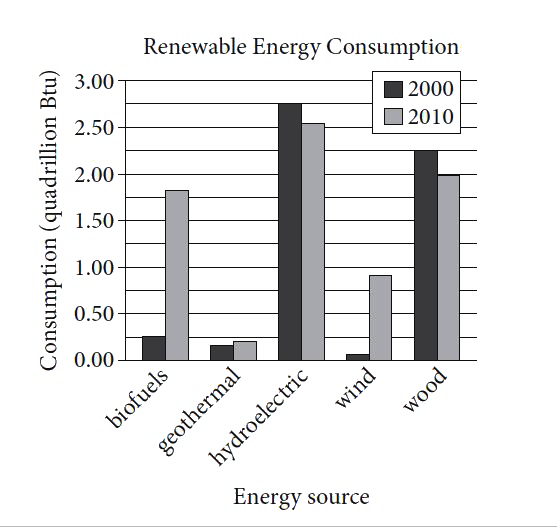
The bar graph above shows renewable energy consumption in quadrillions of British thermal units (Btu) in the United States, by energy source, for several energy sources in the years 2000 and 2010.
Of the following, which best approximates the percent decrease in consumption of wood power in the United States from 2000 to 2010 ?A0.06B0.11C0.21D0.26
Second ionization energy is maximum for
View SolutionCells involved in energy consumption have a large number of a
View SolutionWhich one contains maximum energy ?
View SolutionThe binding energy per nucleon is maximum in the case of.
View SolutionThe binding energy per nucleon is maximum in the case of.
View SolutionThis is an index of free energy content of water
View Solution
