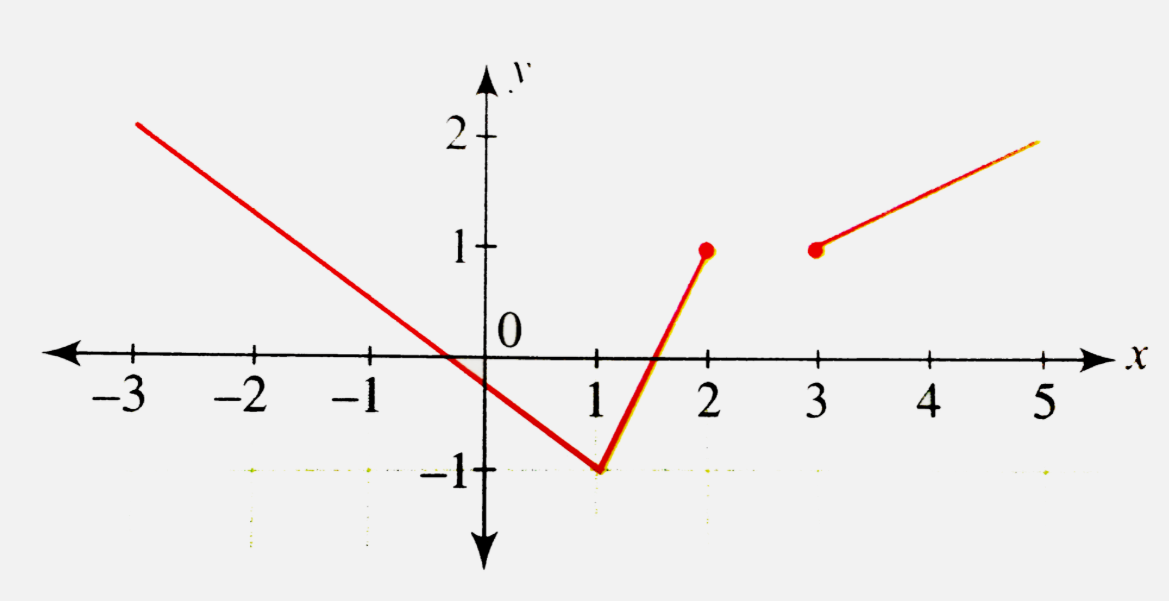
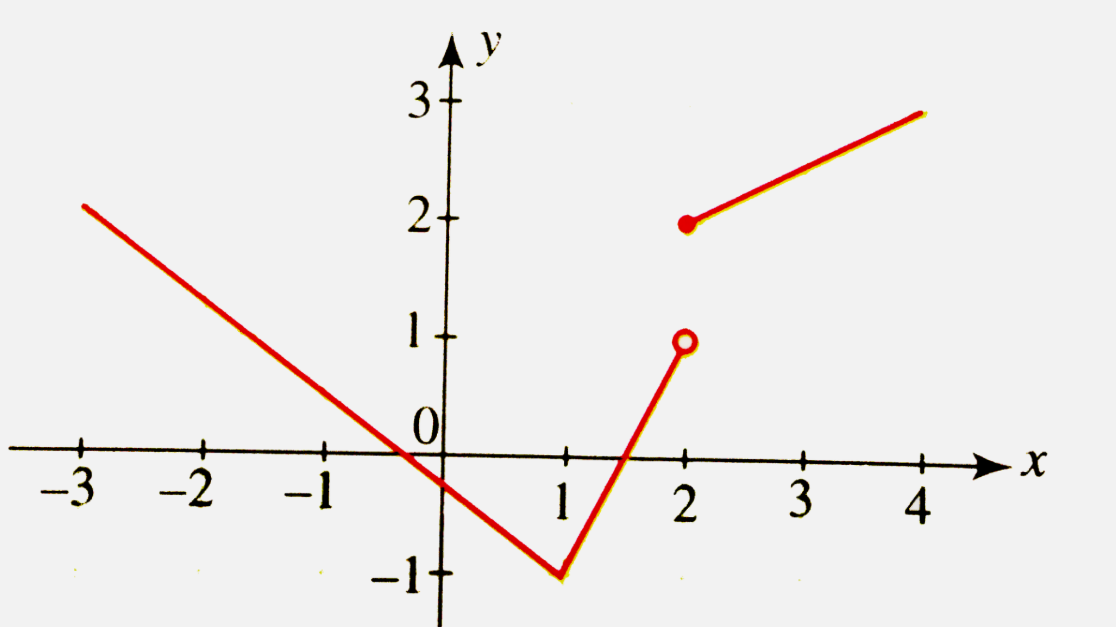
Does the following graph pass the vertical or horizontal line test?
 Solution in Bengali
It passes the vertical line test as any vertical line meets the graph at one point only. But it not pass the horizontal test as line y = 1 meets the graph at (2, 1) and (3, 1). Hence function is many-one.
Topper's Solved these Questions
- BOOK - CENGAGE PUBLICATIONCHAPTER - GETTING STARTED WITH GRAPHSEXERCISE - ILLUSTRATION 1.41videos
GETTING STARTED WITH GRAPHS
- BOOK - CENGAGE PUBLICATIONCHAPTER - GETTING STARTED WITH GRAPHSEXERCISE - ILLUSTRATION 1.51videos
GETTING STARTED WITH GRAPHS
- BOOK - CENGAGE PUBLICATIONCHAPTER - GETTING STARTED WITH GRAPHSEXERCISE - ILLUSTRATION 1.21videos
GETTING STARTED WITH GRAPHS
- BOOK - CENGAGE PUBLICATIONCHAPTER - FUNCTIONSEXERCISE - Comprehension Type7videos
FUNCTIONS
- BOOK - CENGAGE PUBLICATIONCHAPTER - GRAPH OF INVERSE TRIGONOMETRIC FUNCTIONSEXERCISE - Exercises18videos
GRAPH OF INVERSE TRIGONOMETRIC FUNCTIONS
Similar Questions
In how many points graph of y=x3−3x2+5x−3 intersect the x-axis?
01:37View SolutionFollowing is the graph of y = f(x).
<imga≤ocr_imageload∈g=lazysrc=https://d10lpgp6xz60nq.cloudfront.net/physics_images/CEN_GRA_C01_S01_005_Q01.pngwh=80%mx-autosty≤=background:white;><br>F∈dthes√oftheequation f(x) = 0, f(x) = 4 and f(x) = 10.06:07View SolutionDoes the following graph represent a function or a relation?
 02:11View Solution
Let f(x)=x2−2x−1∀x∈R.Letf:(−∞,a]→[b,∞), where a is the largest real number for which f(x) is bijective.
If f:R→R, then range of values of k for which equation f(|x|)=k has 4 distinct real roots is01:31View SolutionDraw the graph of y=tan−1x−cot−1x.
02:45View SolutionHow many lines of symmetry does the above figure have ?
02:17View SolutionWhich of the following are correct chain isomers of butane ? (i)
05:41View SolutionDetermine the point of symmetry of a regular hexagon.
02:10View SolutionDtermine the images of the following figure about the given line :
02:17View SolutionMatch the following Column A to Column B
 02:10View Solution
Match the following Column A to Column B
 04:23View Solution
Match the following Column A to Column B
 02:24View Solution
The inequation represented by the graph given below is :
01:59View SolutionThe inequation that best describes the graph given below is _________
03:12View SolutionThe inequation that best describes the following graph is _________
02:04View SolutionWhich inequations represent the shaded region in the given figure
02:41View Solution

