The graph of the derivative f'(x) is given in the following figure.
(a) Find the interval in which f is increasing or decreasing.
(b) Find the values of x for which f has local maximum or minimum.
(c) Find the intervals in which f is concave upward or downward.
(c) Find the point of inflection.
 Solution in Bengali
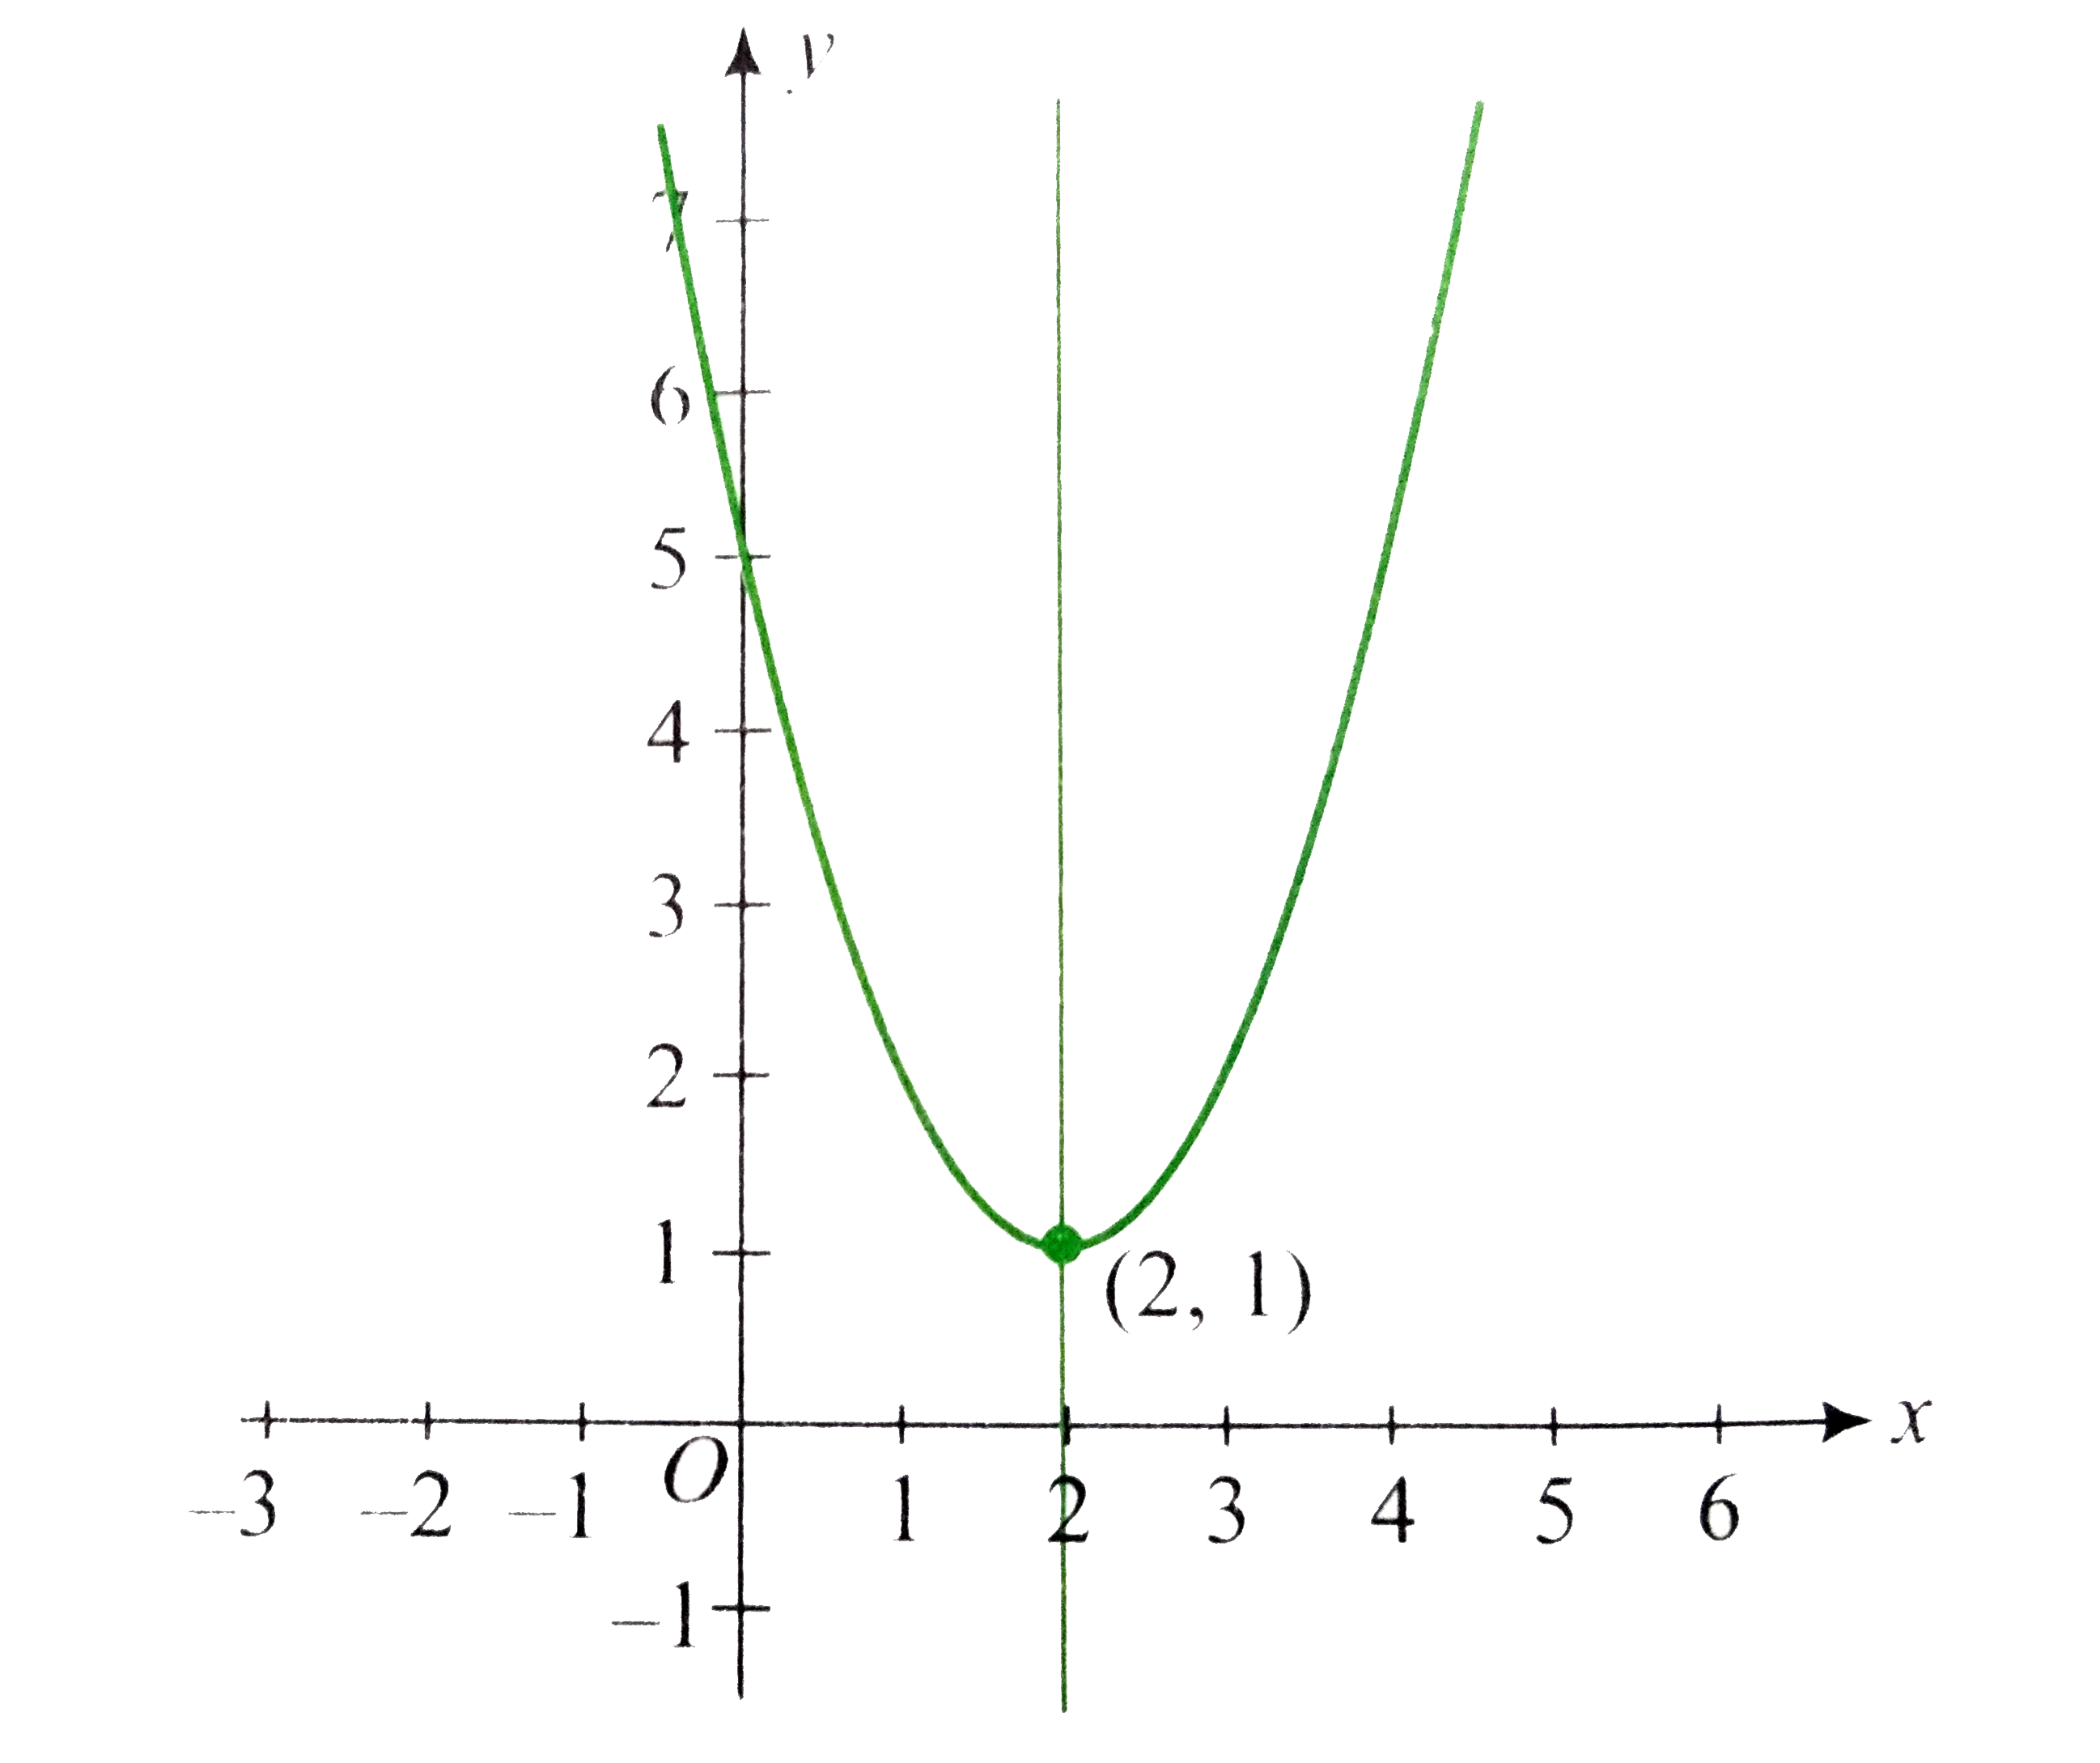
We have f:R→[1,∞),f(x)=x2−4x+5
or f(x)=(x−2)2+1.
Graph of the function is as shown in the following figure.

Clearly f(x) is many-one function.
However, in the interval (−∞,2]or[2,∞),f(x) is one-one.
For f:(−∞,2]→[1,∞),y=(x−2)2+1
∴(x−2)2=y−1
⇒x−2=√y−1
⇒x=2−√y−1
Thus f−1:[1,∞)→(−∞,2],f−1(x)=2−√x−1
For f:[2,∞)→[1,∞),y=(x−2)2+1
⇒x=2+√y−1
Thus f−1:[1,∞)→[2,∞),f−1(x)=√x−1+2
Topper's Solved these Questions
Similar Questions
Let ABCandABC' be two non-congruent triangles with sides AB=4,AC=AC′=2√2 and angle B=300 . The absolute value of the difference between the areas of these triangles is
View SolutionNumber of integral value(s) of λ for which vectors x2ˆi−ˆj+xˆk,(λ−1)ˆi−2λˆj−ˆk and ˆi−ˆj+ˆk, in the order form right-handed system ∀x ∈R, is
(a) 0 (b) 2 (c) 4 (d) 6View SolutionThe graph of the derivative f'(x) is given in the following figure.
(b) Find the values of x for which f has local maximum or minimum.
(c) Find the intervals in which f is concave upward or downward.
(d) Find the point of inflection.
(##CEN_GRA_C01_S01_023_Q01.png" width="80%">03:26View SolutionThe graph of the derivative f'(x) is given in the following figure.
(a) Find the interval in which f is increasing or decreasing.
(b) Find the values of x for which f has local maximum or minimum.
(c) Find the intervals in which f is concave upward or downward.
(c) Find the point of inflection.
 05:41View Solution
In the given figure (not to scale), O is the centre of the circle. A,B,C and D are concyclic and AB=CD . If /_MON =120^(@) , then find /_ OPN .
03:28View SolutionMatch the following Column A to Column B
 02:31View Solution
Find the area of figure given below.
 02:21View Solution
Find the perimeter of the figure given below.
 02:10View Solution
Find the area of the figure given below.
 02:17View Solution
The inequation represented by the graph given below is :
02:10View SolutionThe inequation that best describes the graph given below is _________
04:23View SolutionThe inequation that best describes the following graph is _________
01:13View SolutionWhich inequations represent the shaded region in the given figure
03:02View SolutionIn Fig, find the value of x.
ltimg src="https://d10lpgp6xz60nq.cloudfront.net/physics_images/PS_MATH_IX_C12_S01_032_Q01.png" width="80%"gt06:23View SolutionIn the given figure, PQRS is a parallelogram. A and B are the mid-point of ¯¯¯¯¯¯PQ and ¯¯¯¯¯SR respectively. If PS=BR, then the quadrilateral ADBC is a…………………… ,
ltimg src="https://d10lpgp6xz60nq.cloudfront.net/physics_images/PS_MATH_IX_C12_E05_020_Q01.png" width="80%"gt03:07View SolutionWhich has maximum XCX bond angle ? (X=F,Cl,Br)
03:10View Solution

