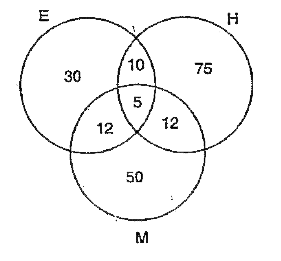
Consider the given diagram 500 candidate appeared in an examination conducted for the tests in English , Hindi and Maths represented by the circle E H and M respectively . the diagram M gives the number of candidates who failed in different tests ?
Singleton set
null set
infinite set
disjoint set
The correct Answer is:B
Step by step video, text & image solution for Consider the given diagram 500 candidate appeared in an examination conducted for the tests in English , Hindi and Maths represented by the circle E H and M respectively . the diagram M gives the number of candidates who failed in different tests ? by Maths experts to help you in doubts & scoring excellent marks in Class 7 exams.
Topper's Solved these Questions
- BOOK - S CHAND IIT JEE FOUNDATIONCHAPTER - SETSEXERCISE - Self Assessment Sheet10videos
SETS
- BOOK - S CHAND IIT JEE FOUNDATIONCHAPTER - SETSEXERCISE - Self Assessment Sheet10videos
SETS
- BOOK - S CHAND IIT JEE FOUNDATIONCHAPTER - RATIO AND PROPORTION EXERCISE - SELF ASSESSMENT SHEET - 1510videos
RATIO AND PROPORTION
- BOOK - S CHAND IIT JEE FOUNDATIONCHAPTER - SIMPLE INTEREST EXERCISE - Self Assessment Sheet10videos
SIMPLE INTEREST
Similar Questions
Consider the given diagram 500 candidate appeared in an examination conducted for the tests in English , Hindi and Maths represented by the circle E H and M respectively . the diagram gives the number of candidates who failed in different tests ?
What is the percentage of candidates who failed in atleast two subjects ?
 View Solution
Consider the Venn diagram given below:
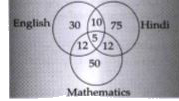
Five hundred candidates appeared in an examination comprising of tests in English, Hindi and Mathematics. The diagram gives the number of candidates who failed in different tests. What is the percentage of candidates who failed in at least two subjects ?View Solution
Knowledge Check
- Question 1 - Select One
Study the following table carefully and answer the questions given below it. Number of candidates appearing for an interview for a post in Bank and percentage of candidates qualifying
Figure
What was the respective ratio of the number of candidates who qualified in bank A to the number of candidates who qualified in bank E?A5:6B2:5C3:7D5:8 - Question 2 - Select One
The diagram gives the number of candidates who failed in Chemistry, Electronics and English in different tests. The total number of candidates appeared was 600. What is the percentage of candidates who failed in at least two subject?
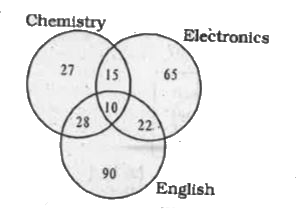 A12.5B1.25C12.05D12
 - Question 3 - Select One
The Table shows the number of candidates appearing for an interview for a post in six Banks (H,I,J,L,M) and percentage of qualifying candidates.
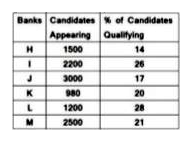
What was respective ratio of the number of candidates who qualified in bank H to the number of candidates who qualified in bank L ?A5:8B2:5C3:7D5:6
In a certain examination, the candidates can offer papers in English or Hindi or both the subjects. The number of candidates who appeared in the examination is 1000 of whom 650 appeared in English and 200 appeared in both English and Hindi.Based on this information answer the questions given below: Find the number of candidates who offered paper in Hindi.
View SolutionIn an examination, 60% of the candidates passed in English and 70% of the candidates passed in Mathematics, but 20% failed in both of these subjects. If 2500 candidates passed in both the subjects, the number of candi dates who appeared at the ex amination was
View SolutionThe following table represents the number of candidates that appeared and qualified in a competitive examination from different states over five years. Study the table and answer the questions that follow. What is the difference between the number of candidates qualifying in the year 1998, in the states M and P?
निम्नलिखित तालिका उन उम्मीदवारों की संख्या को दर्शाती है जो पाँच वर्षों के दौरान विभिन्न राज्यों से किसी प्रतियोगी परीक्षा में शामिल हुए तथा सफल हुए | इस तालिका का अध्ययन कीजिए तथा फिर पूछे गए प्रश्नों के उत्तर दीजिए |
वर्ष 1998 में राज्य M तथा P से सफल होने वाले उम्मीदवारों की संख्या में क्या अंतर है ?View SolutionStudy the following graph and answer the questions that follows:-
Number of appeared candidates and passed Candidates (in hundreds) in a test from six different institutions.
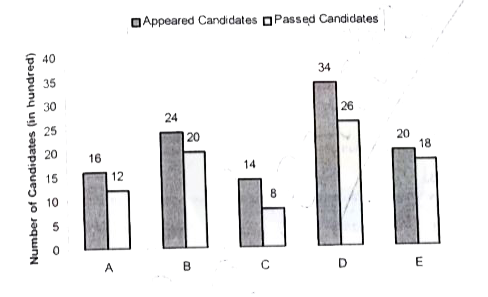
What is the respective ratio between the number of candidates who have failed from institution B and the number of candidates who have appeared from institutions E ?View SolutionStudy the following table and answer questions:
Number of candidates appeared in an examination from five cities:
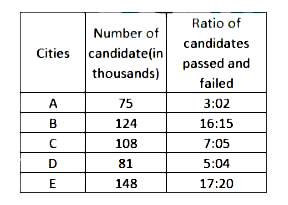
The ratio of the total number of candidates who passed from cities A and C to that who failed in cities B and E is:View Solution

