Vinod took a beaker of ice from a freezer and measured its temperature immediately. Then he measured the temperature of the ice in the beaker every 2 minutes. His results are shown in the graph. Vinod noticed during his experiment that the temperature of the ice did not change for a period of time.
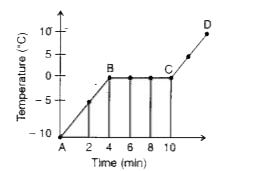
Which part of the graph corresponds to this period of time?
BC
Similar Questions
Vinod took a beaker of ice from a freezer and measured its temperature immediately. Then he measured the temperature of the ice in the beaker every 2 minutes. His results are shown in the graph. Vinod noticed during his experiment that the temperature of the ice did not change for a period of time.
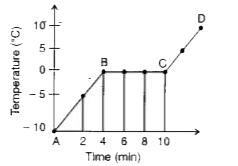
How long was this period of time?
View SolutionVinod took a beaker of ice from a freezer and measured its temperature immediately. Then he measured the temperature of the ice in the beaker every 2 minutes. His results are shown in the graph. Vinod noticed during his experiment that the temperature of the ice did not change for a period of time.
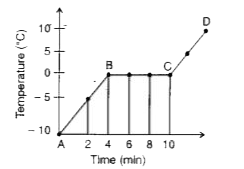
What change did the ice undergo during this period of time?
View Solution
Knowledge Check
A glass tumbler containing hot water is kept in the freezer compartment of a refrigerator (temperature <0∘C). If you could measure the temperature of the content of the tumbler , which of the following graphs would correctly represent the change in its temperature as a function of time.
A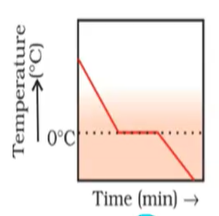 B
B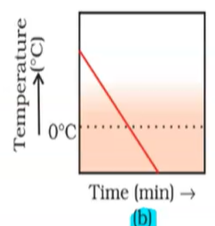 C
C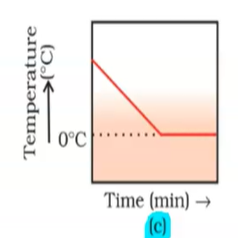 D
D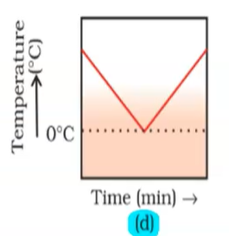
A student heats a beaker containing ice and water. He measures the temperature of the content of the beaker as a function of lime. Which of the following would correctly represent the result ? Justify your choice .

View SolutionA student heats a beaker containing ice and water. He measures the temperature of the content of the beaker as a function of lime. Which of the following would correctly represent the result ? Justify your choice .

View SolutionFour arrangements to measure temperatur of ice in beaker with laboratory thermometer are shows in figure (a, b, c and d). Which one of them shows the correct arrangement for accurate measurement of temperature ?
View SolutionA glass tumbler containing hot water is kept in the freezer compartment of a refrigerator (temperature <0∘C). If you could measure the temperature of the content of the tumbler , which of the following graphs would correctly represent the change in its temperature as a function of time.
View Solution
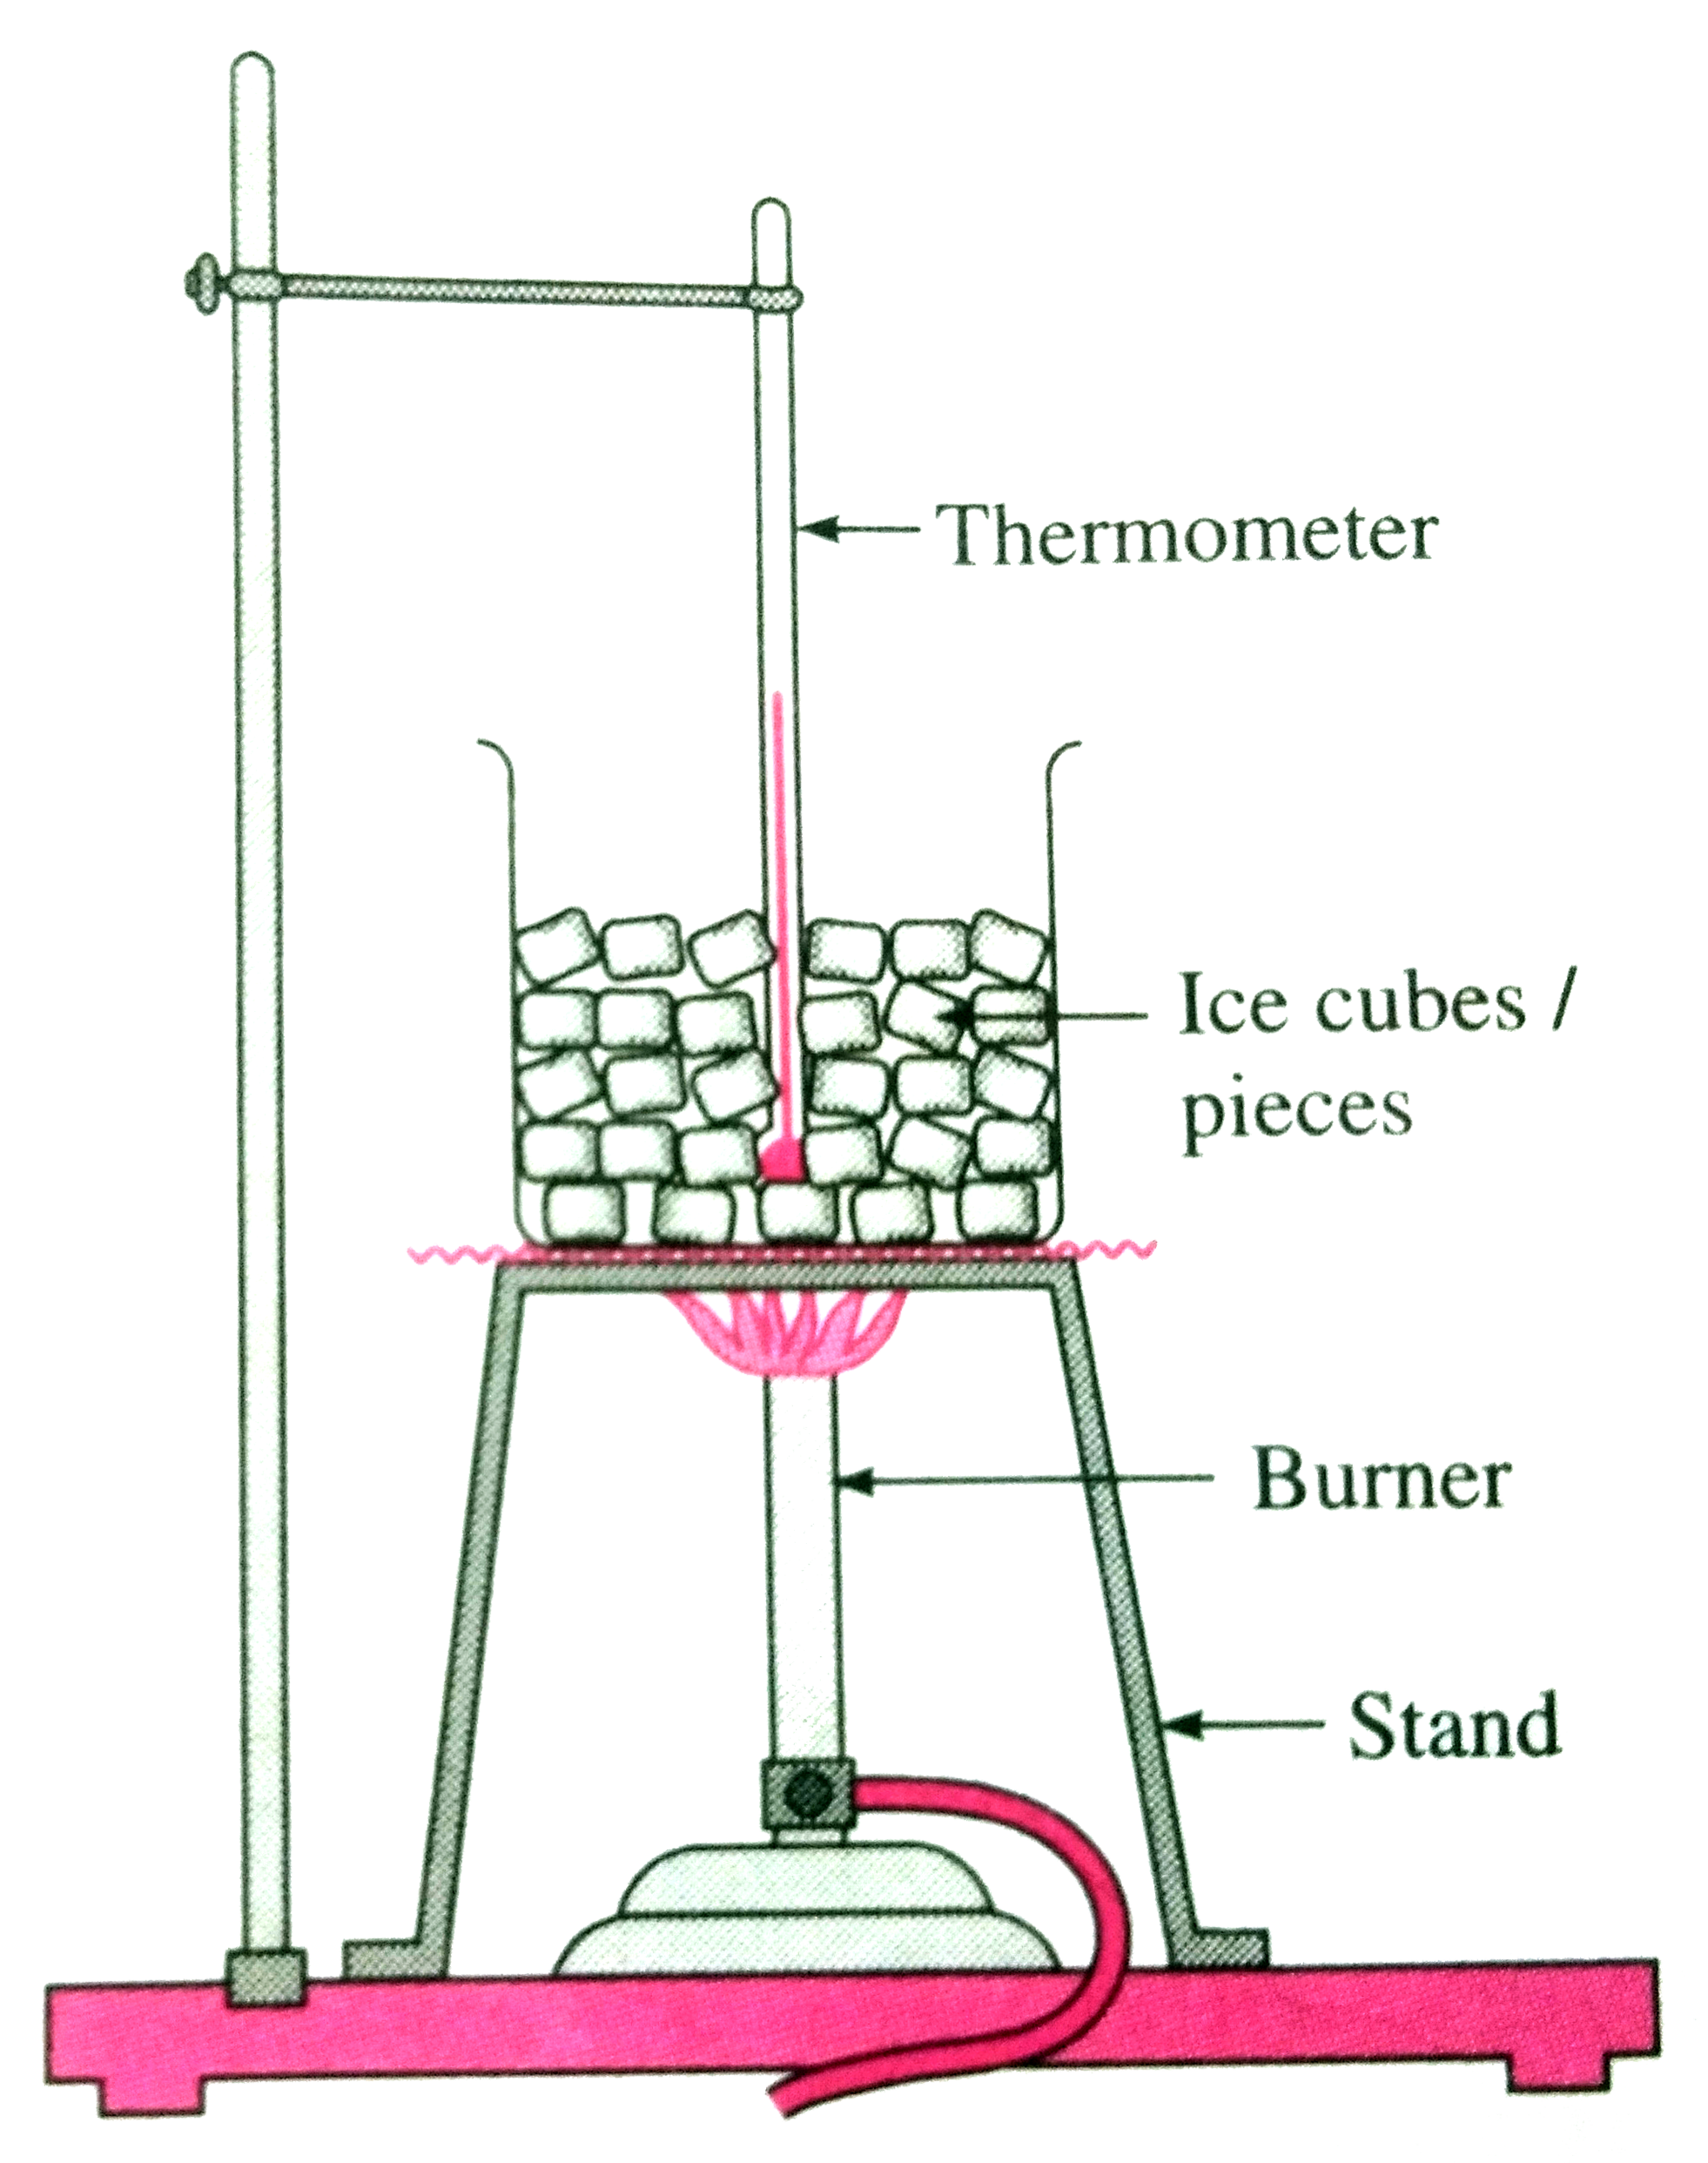
(1) Take a few pieces of ice in a glass beaker as shown in figure.
(2) Insert the bulb of a thermometer in ice and measure its temperature.
(3) Put the beaker on a stand and heat the ice usinga burner.
(4) Record the temperature using the thermometer after every minute.
(5) As the ice is heated,it starts melting. Stir the mixture of ice and water.
(6) Continue the heating even after ice starts melting.
(7) Draw a graph of temperature versus time.
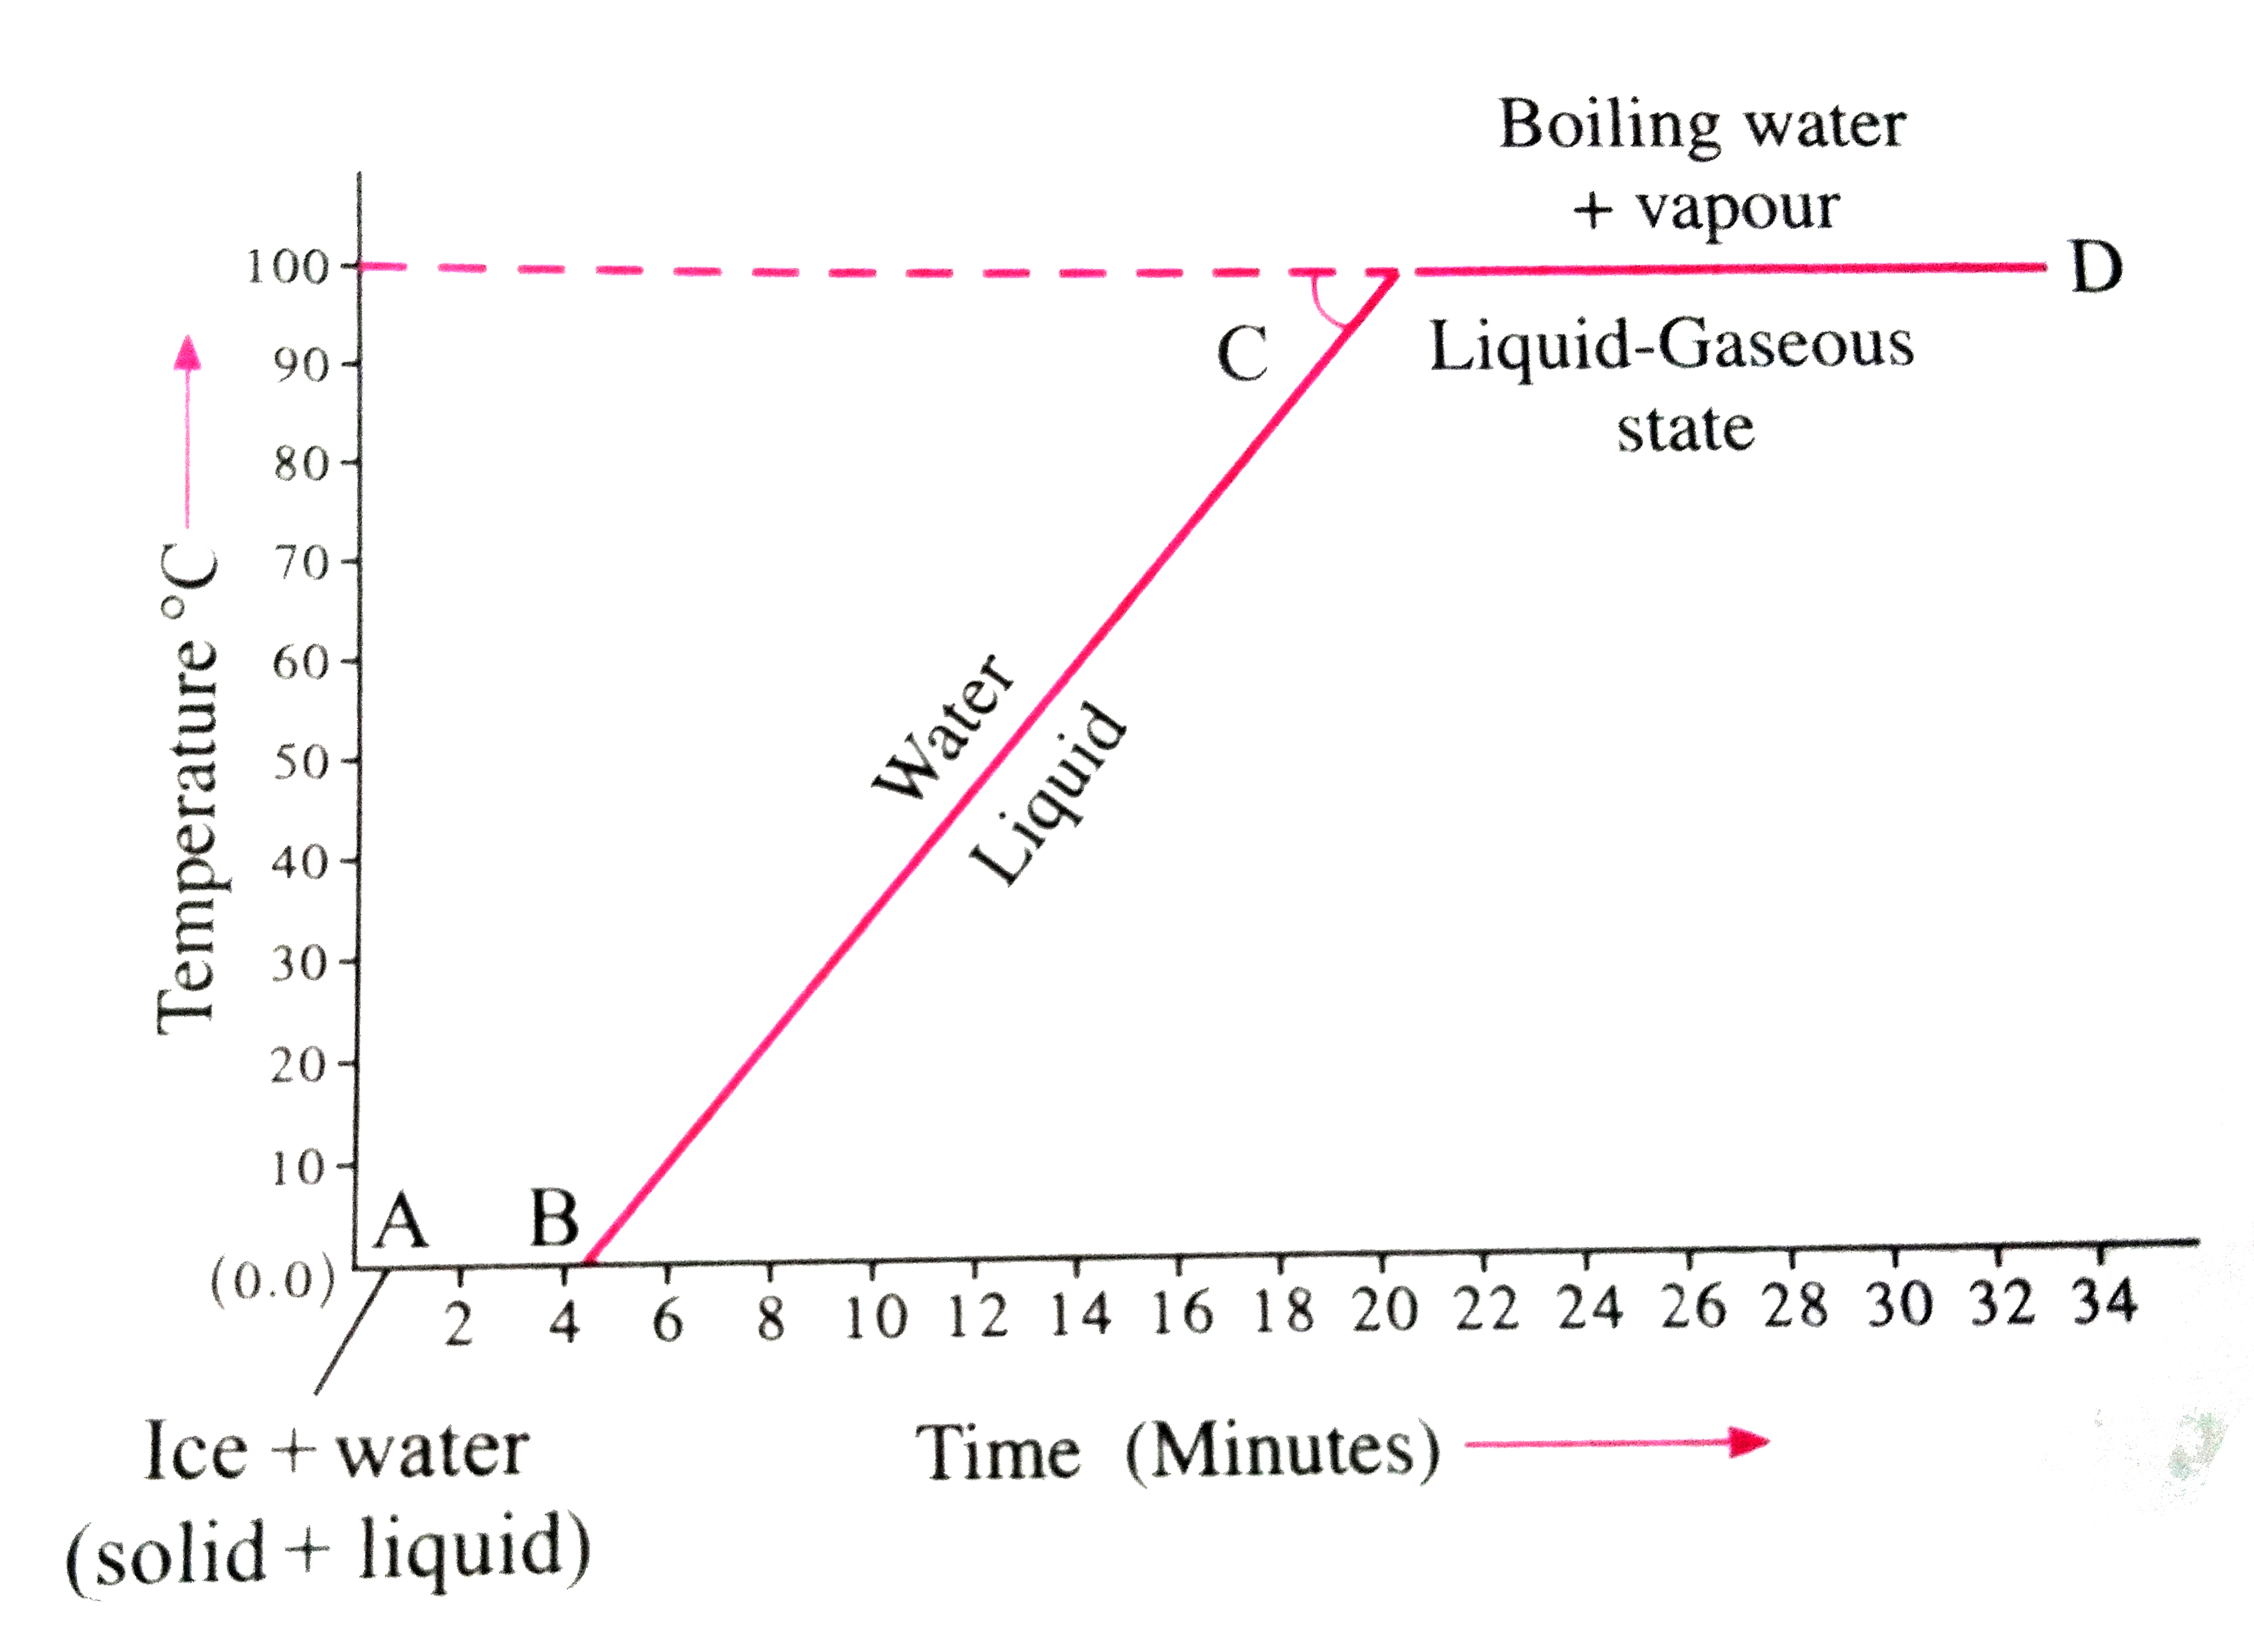
Explain the following temperature vs time graph.
View Solution(1) Take a few pieces of ice in a glass beaker as shown in figure.
(2) Insert the bulb of a thermometer in ice and measure its temperature.
(3) Put the beaker on a stand and heat the ice using a burner.
(4) Record the temperature using the thermometer after every minute.
(5) As the ice is heated,it starts melting. Stir the mixture of ice and water.
(6) Continue the heating even after ice starts melting.
(7) Draw a graph of temperature versus time.
Explain the role of latent heat in the change of state of a substance.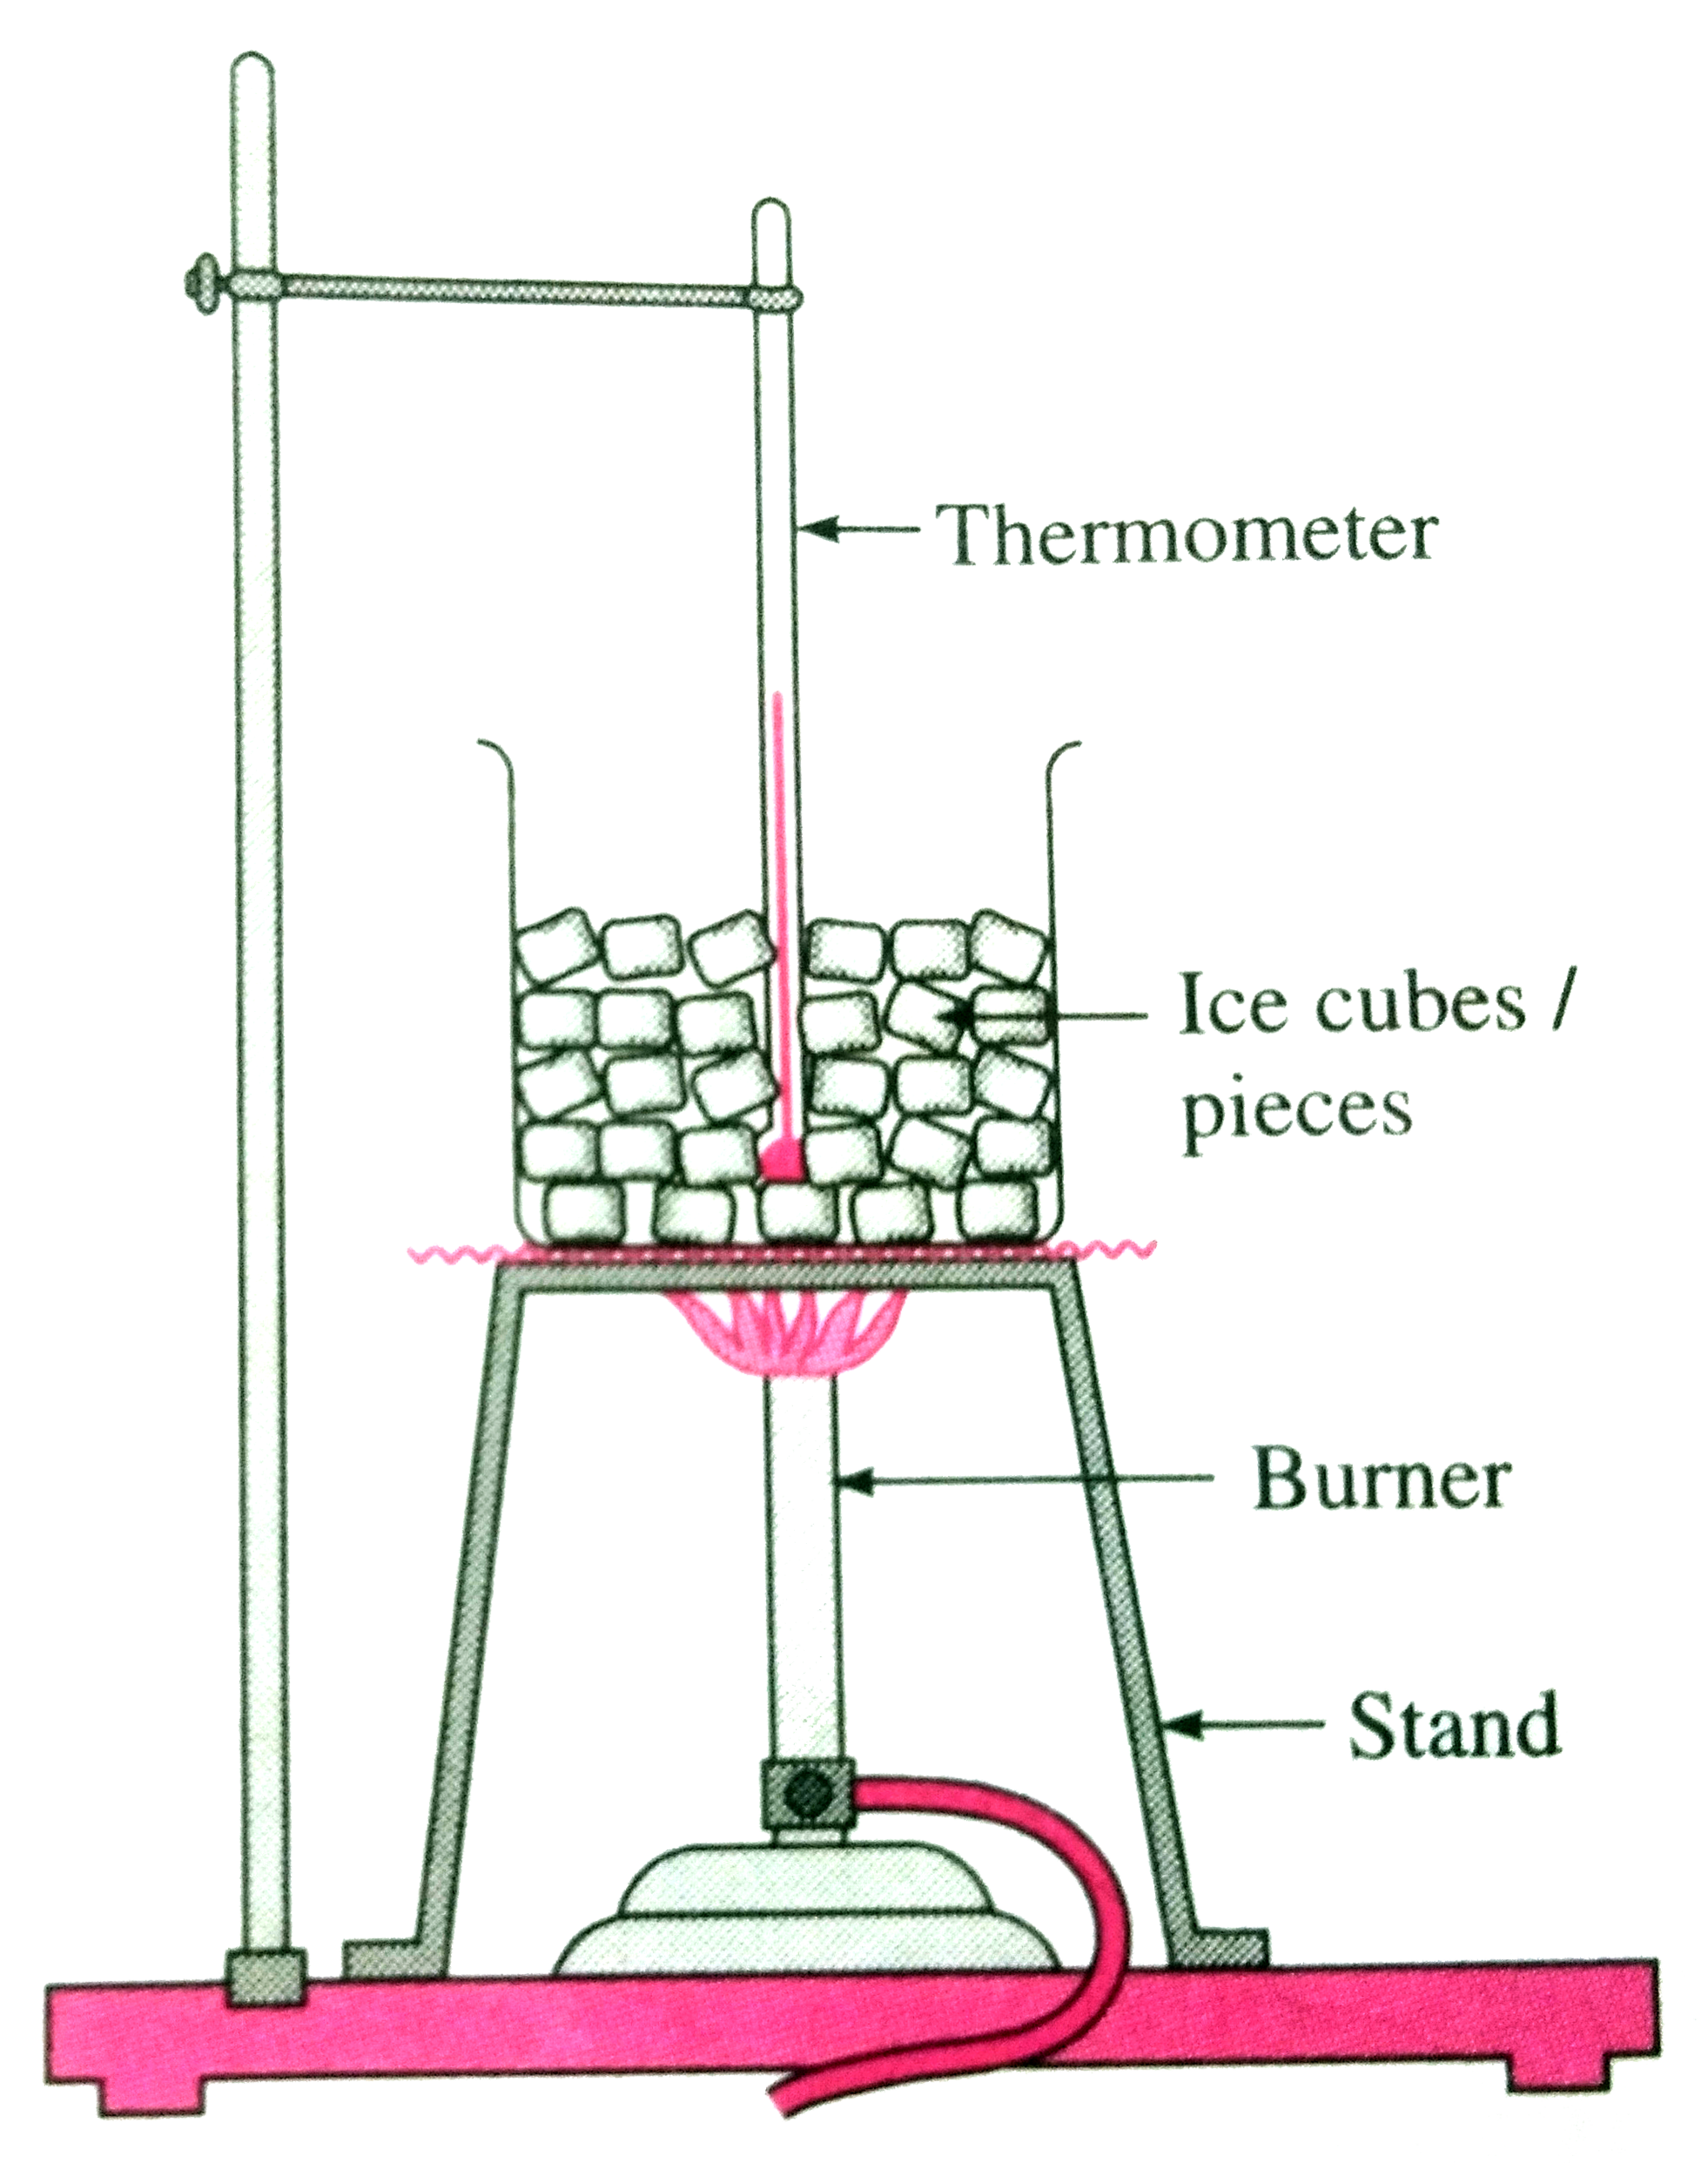
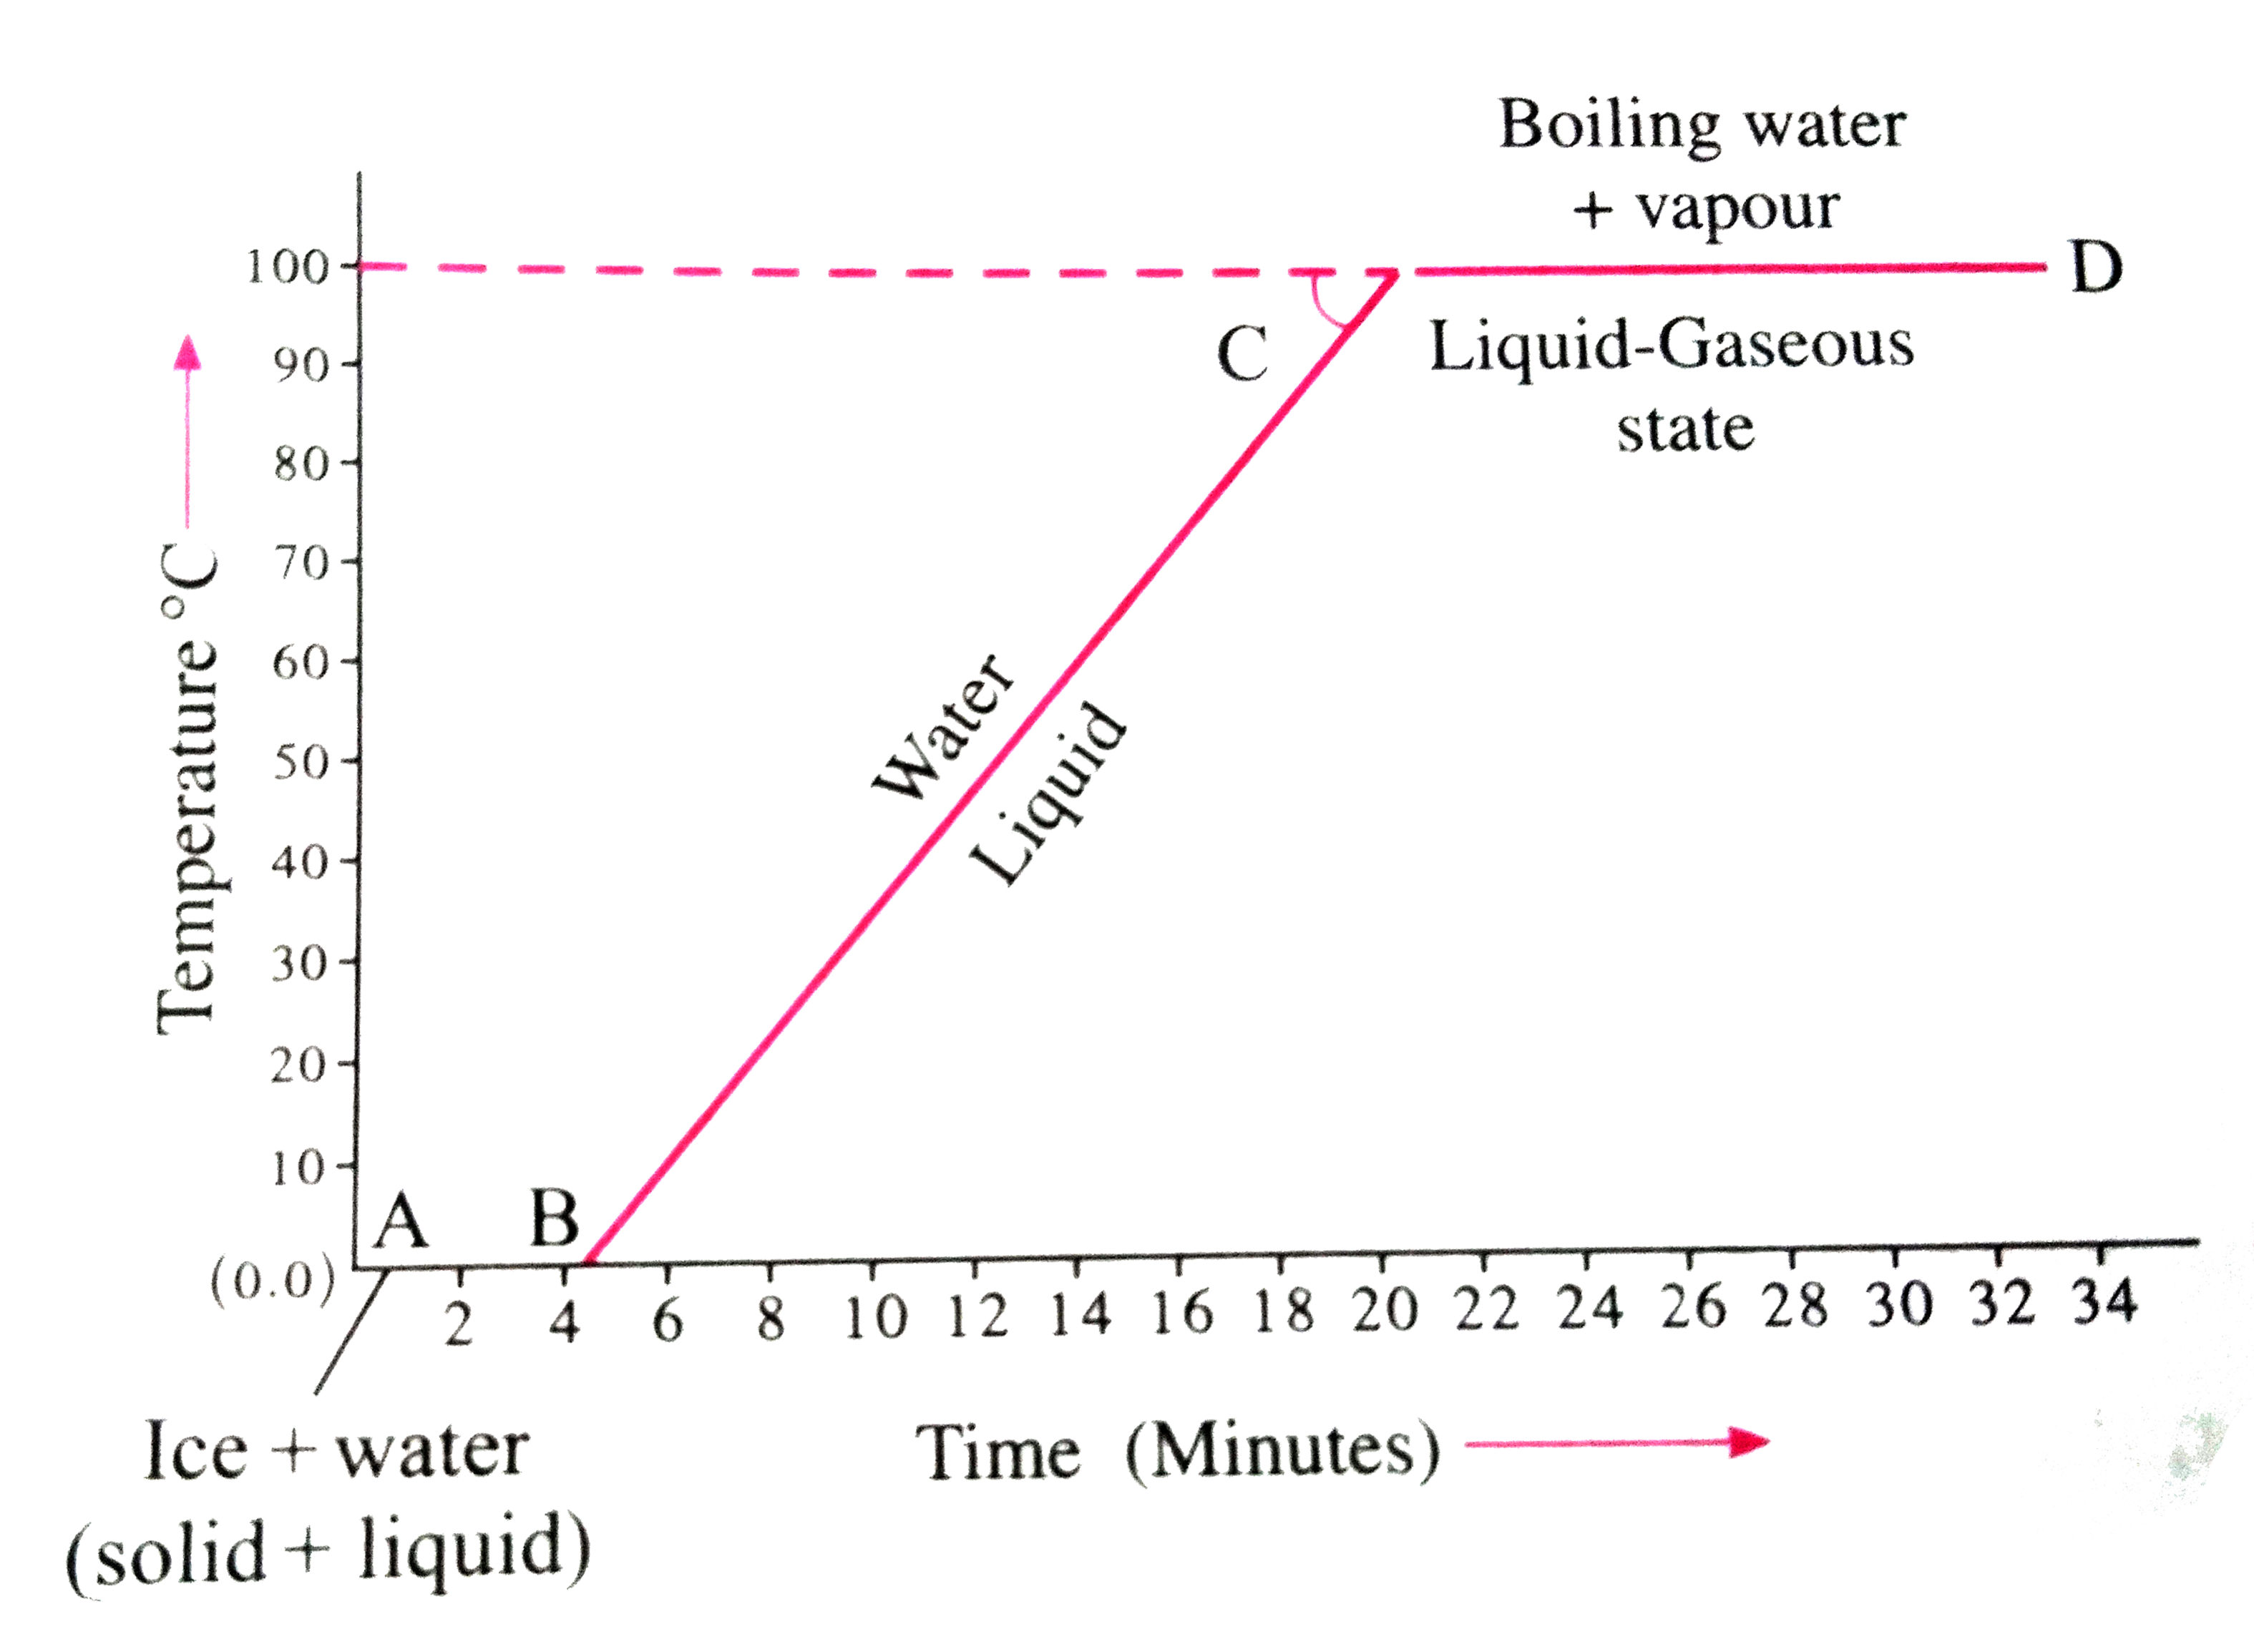
View Solution(1) Take a few pieces of ice in a glass beaker as shown in figure.
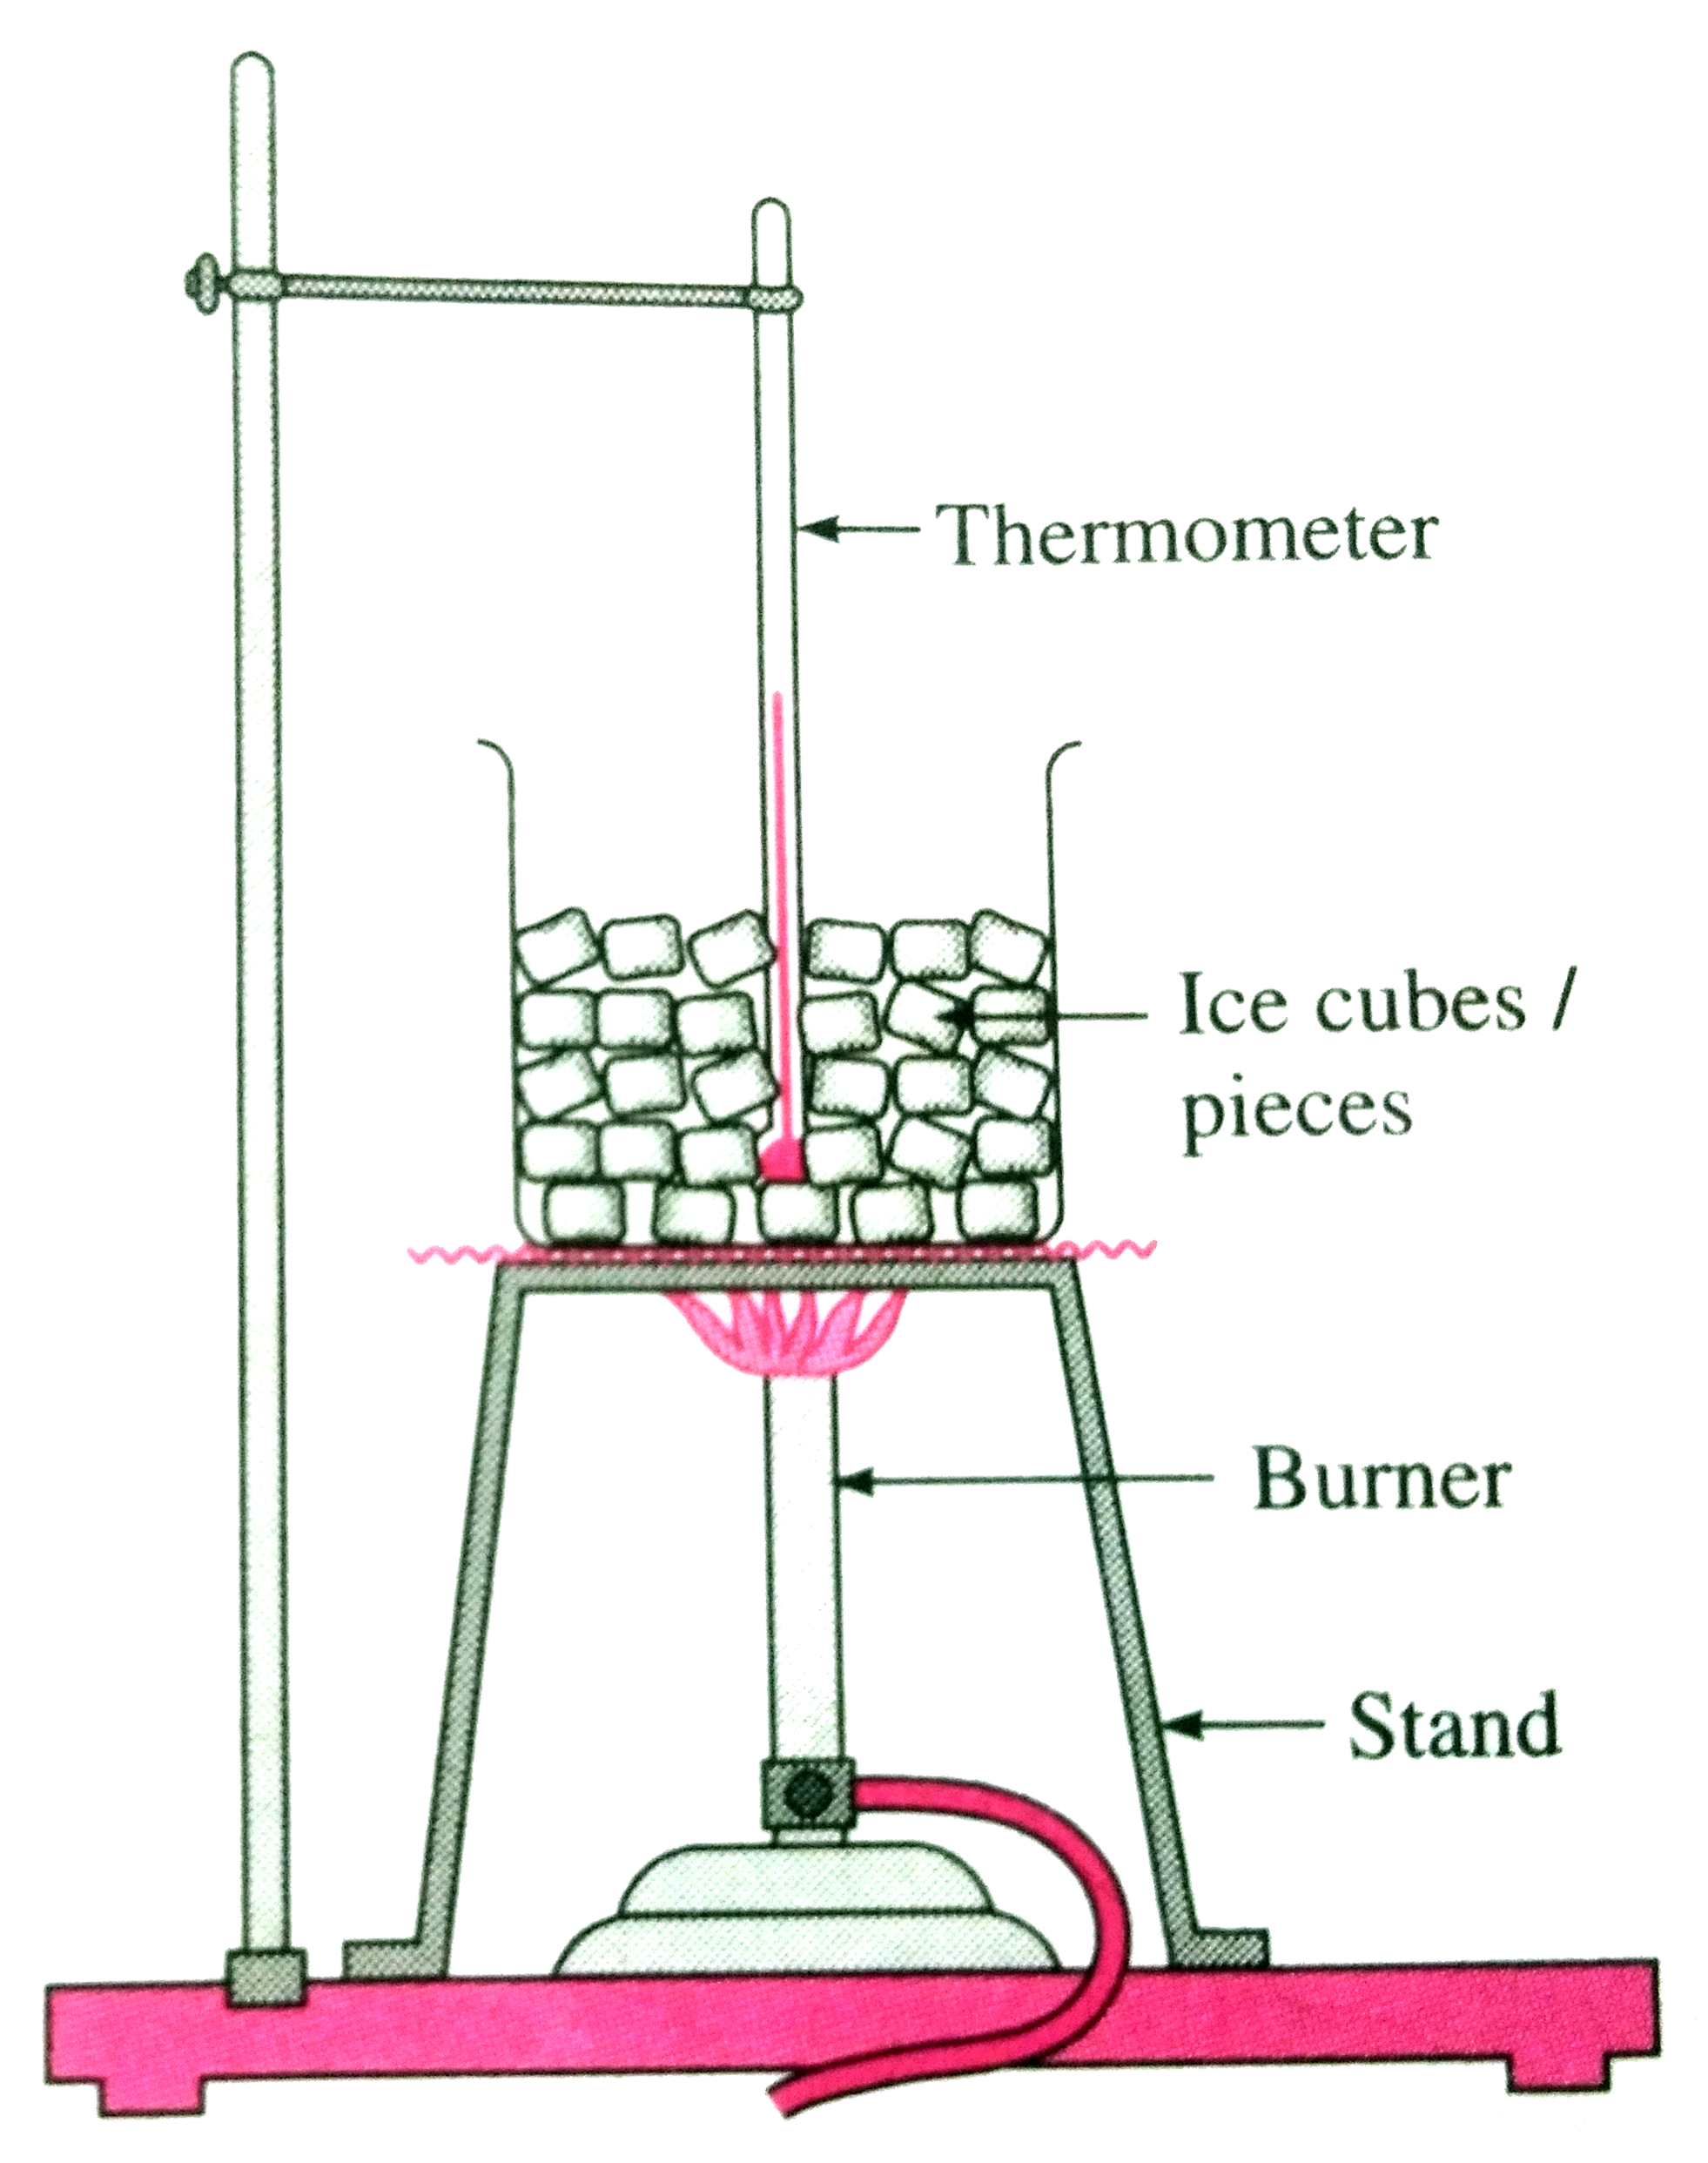
(2) Insert the bulb of a thermometer in ice and measure its temperature.
(3) Put the beaker on a stand and heat the ice using a burner.
(4) Record the temperature using the thermometer after every minute.
(5) As the ice is heated,it starts melting. Stir the mixture of ice and water.
(6) Continue the heating even after ice starts melting.
(7) Draw a graph of temperature versus time.
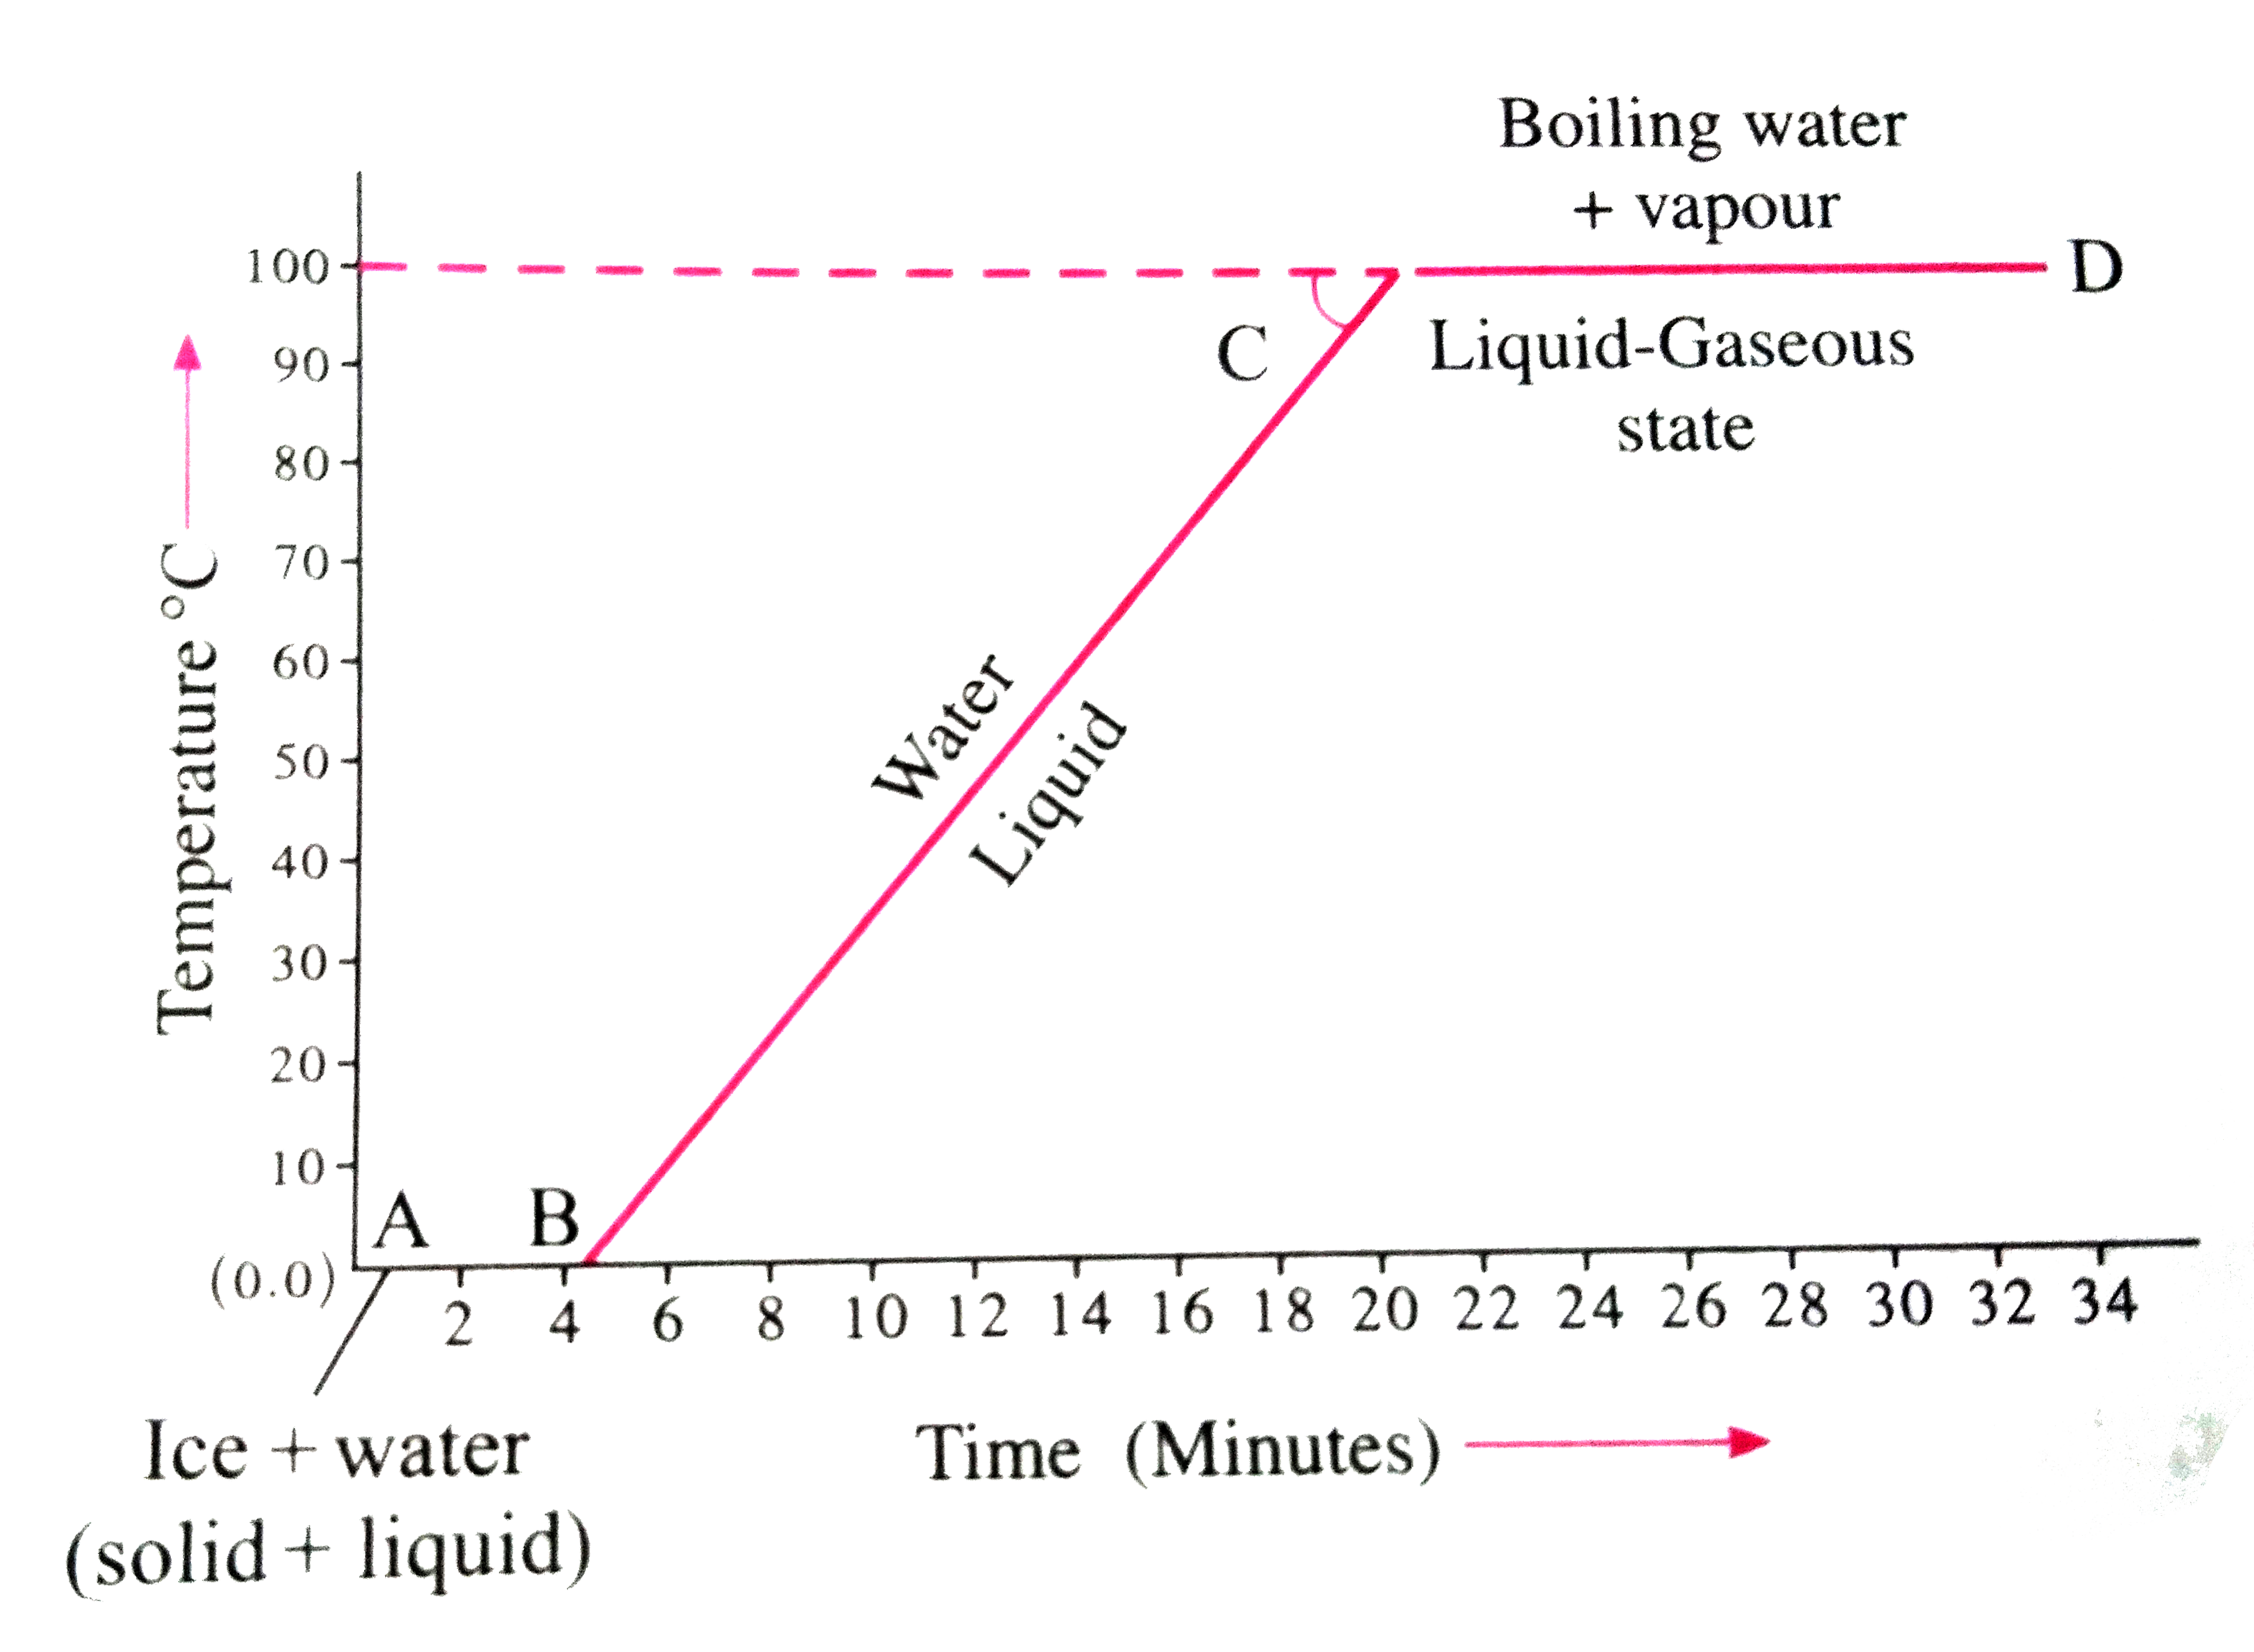
Define boiling point of a liquid. OR What is boiling point of a liquid ?
View Solution
