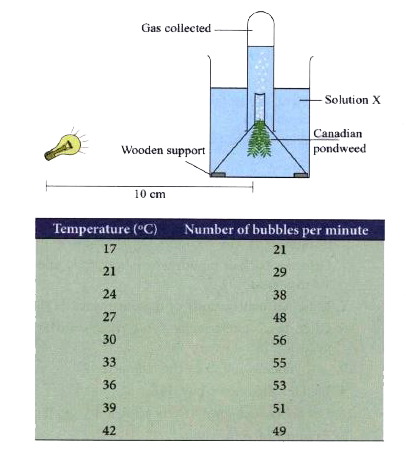
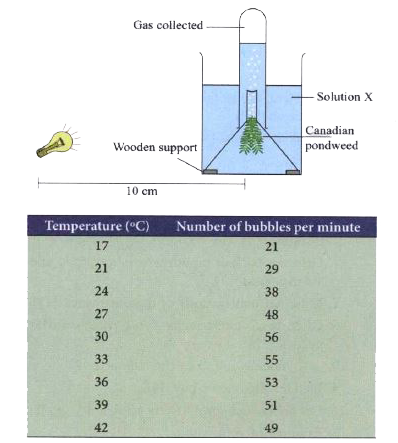
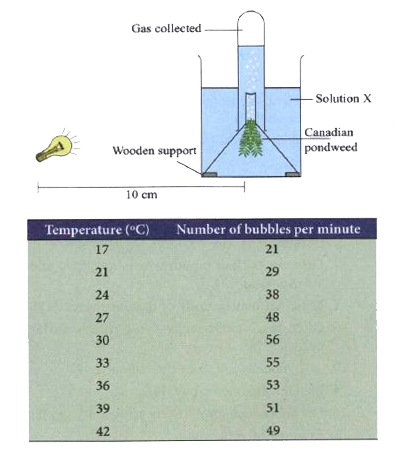
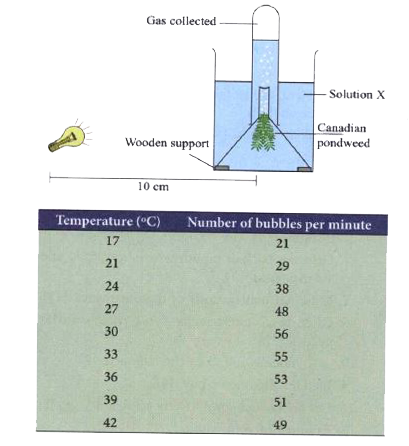
Diagram below depicts an experiment to find the effect of temperature on the rate of photosynthesis. The average number of bubbles per minute at each temperature is given in the table.

Describe and explain the change in rate of photosynthesis as the temperature is changed
(i) from 17∘C to 30∘C.
(ii) from 33∘C to 40∘C.
Step by step video & image solution for Diagram below depicts an experiment to find the effect of temperature on the rate of photosynthesis. The average number of bubbles per minute at each temperature is given in the table. Describe and explain the change in rate of photosynthesis as the temperature is changed (i) from 17^@C to 30^@C. (ii) from 33^@C to 40^@C. by Biology experts to help you in doubts & scoring excellent marks in Class 10 exams.
Updated on:21/07/2023Topper's Solved these Questions
- NUTRITION IN PLANTS AND ANIMALS BOOK - CENGAGE BIOLOGYCHAPTER - NUTRITION IN PLANTS AND ANIMALS EXERCISE - CONSOLIDATED EXERCISE (MCQs)
63 Videos
- NUTRITION IN PLANTS AND ANIMALS BOOK - CENGAGE BIOLOGYCHAPTER - NUTRITION IN PLANTS AND ANIMALS EXERCISE - OLYMPIAD AND NTSE LEVEL EXERCISES
10 Videos
- NUTRITION IN PLANTS AND ANIMALS BOOK - CENGAGE BIOLOGYCHAPTER - NUTRITION IN PLANTS AND ANIMALS EXERCISE - MANDATORY EXERCISE (EXERCISE SET II)
23 Videos
- NERVOUS SYSTEM AND SENSE ORGANS : CONTROL AND CO-ORDINATIONBOOK - CENGAGE BIOLOGYCHAPTER - NERVOUS SYSTEM AND SENSE ORGANS : CONTROL AND CO-ORDINATIONEXERCISE - CHALLENGING EXERCISE
2 Videos
- REPRODUCTIONBOOK - CENGAGE BIOLOGYCHAPTER - REPRODUCTIONEXERCISE - CHALLENGING EXERCISE
3 Videos
Similar Questions
Diagram below depicts an experiment to find the effect of temperature on the rate of photosynthesis. The average number of bubbles per minute at each temperature is given in the table.

Plot a graph to show the relation between the rate of photosynthesis and temperature.
View SolutionDiagram below depicts an experiment to find the effect of temperature on the rate of photosynthesis. The average number of bubbles per minute at each temperature is given in the table.

Why should the funnel be raised by wooden supports?
View Solution
Knowledge Check
By what factor does the rate of reaction increases when the temperature is increased from 30∘C to 60∘C ?
A16B8C32D64The rate of reaction is doubled for every 10∘C rise in temperature. The increase in reaction rate as a result of temperature rise from 10∘C to 80∘C is
A112B512C256D128The temperature coefficient of a reaction is 2, by what factor the rate of reaction increases when temperature is increased from 30∘C to 80∘C ?
A16B32C64D128
Diagram below depicts an experiment to find the effect of temperature on the rate of photosynthesis. The average number of bubbles per minute at each temperature is given in the table.

(i) Name the gas collected.
(ii) What test would you do to identify the gas?
(iii) What is the importance of this gas to other organisms in the ecosystem?
View SolutionHow many times the rate of reaction will change if temperature is increased from 20∘C to 50∘C ?
View SolutionThe temperature is changed from 27∘C to 327∘C Find ratio of K.E. of molecules at two temperatures.
View SolutionThe rate of a reaction triples when temperature change from 20∘C to 50∘C . Calculate the energy of activation.
View SolutionThe rate of a reaction gets doubled when the temperature change from 7∘C to 17∘C. By what factor will it change for the the temperature change from 17∘C to 27∘C ?
View Solution
