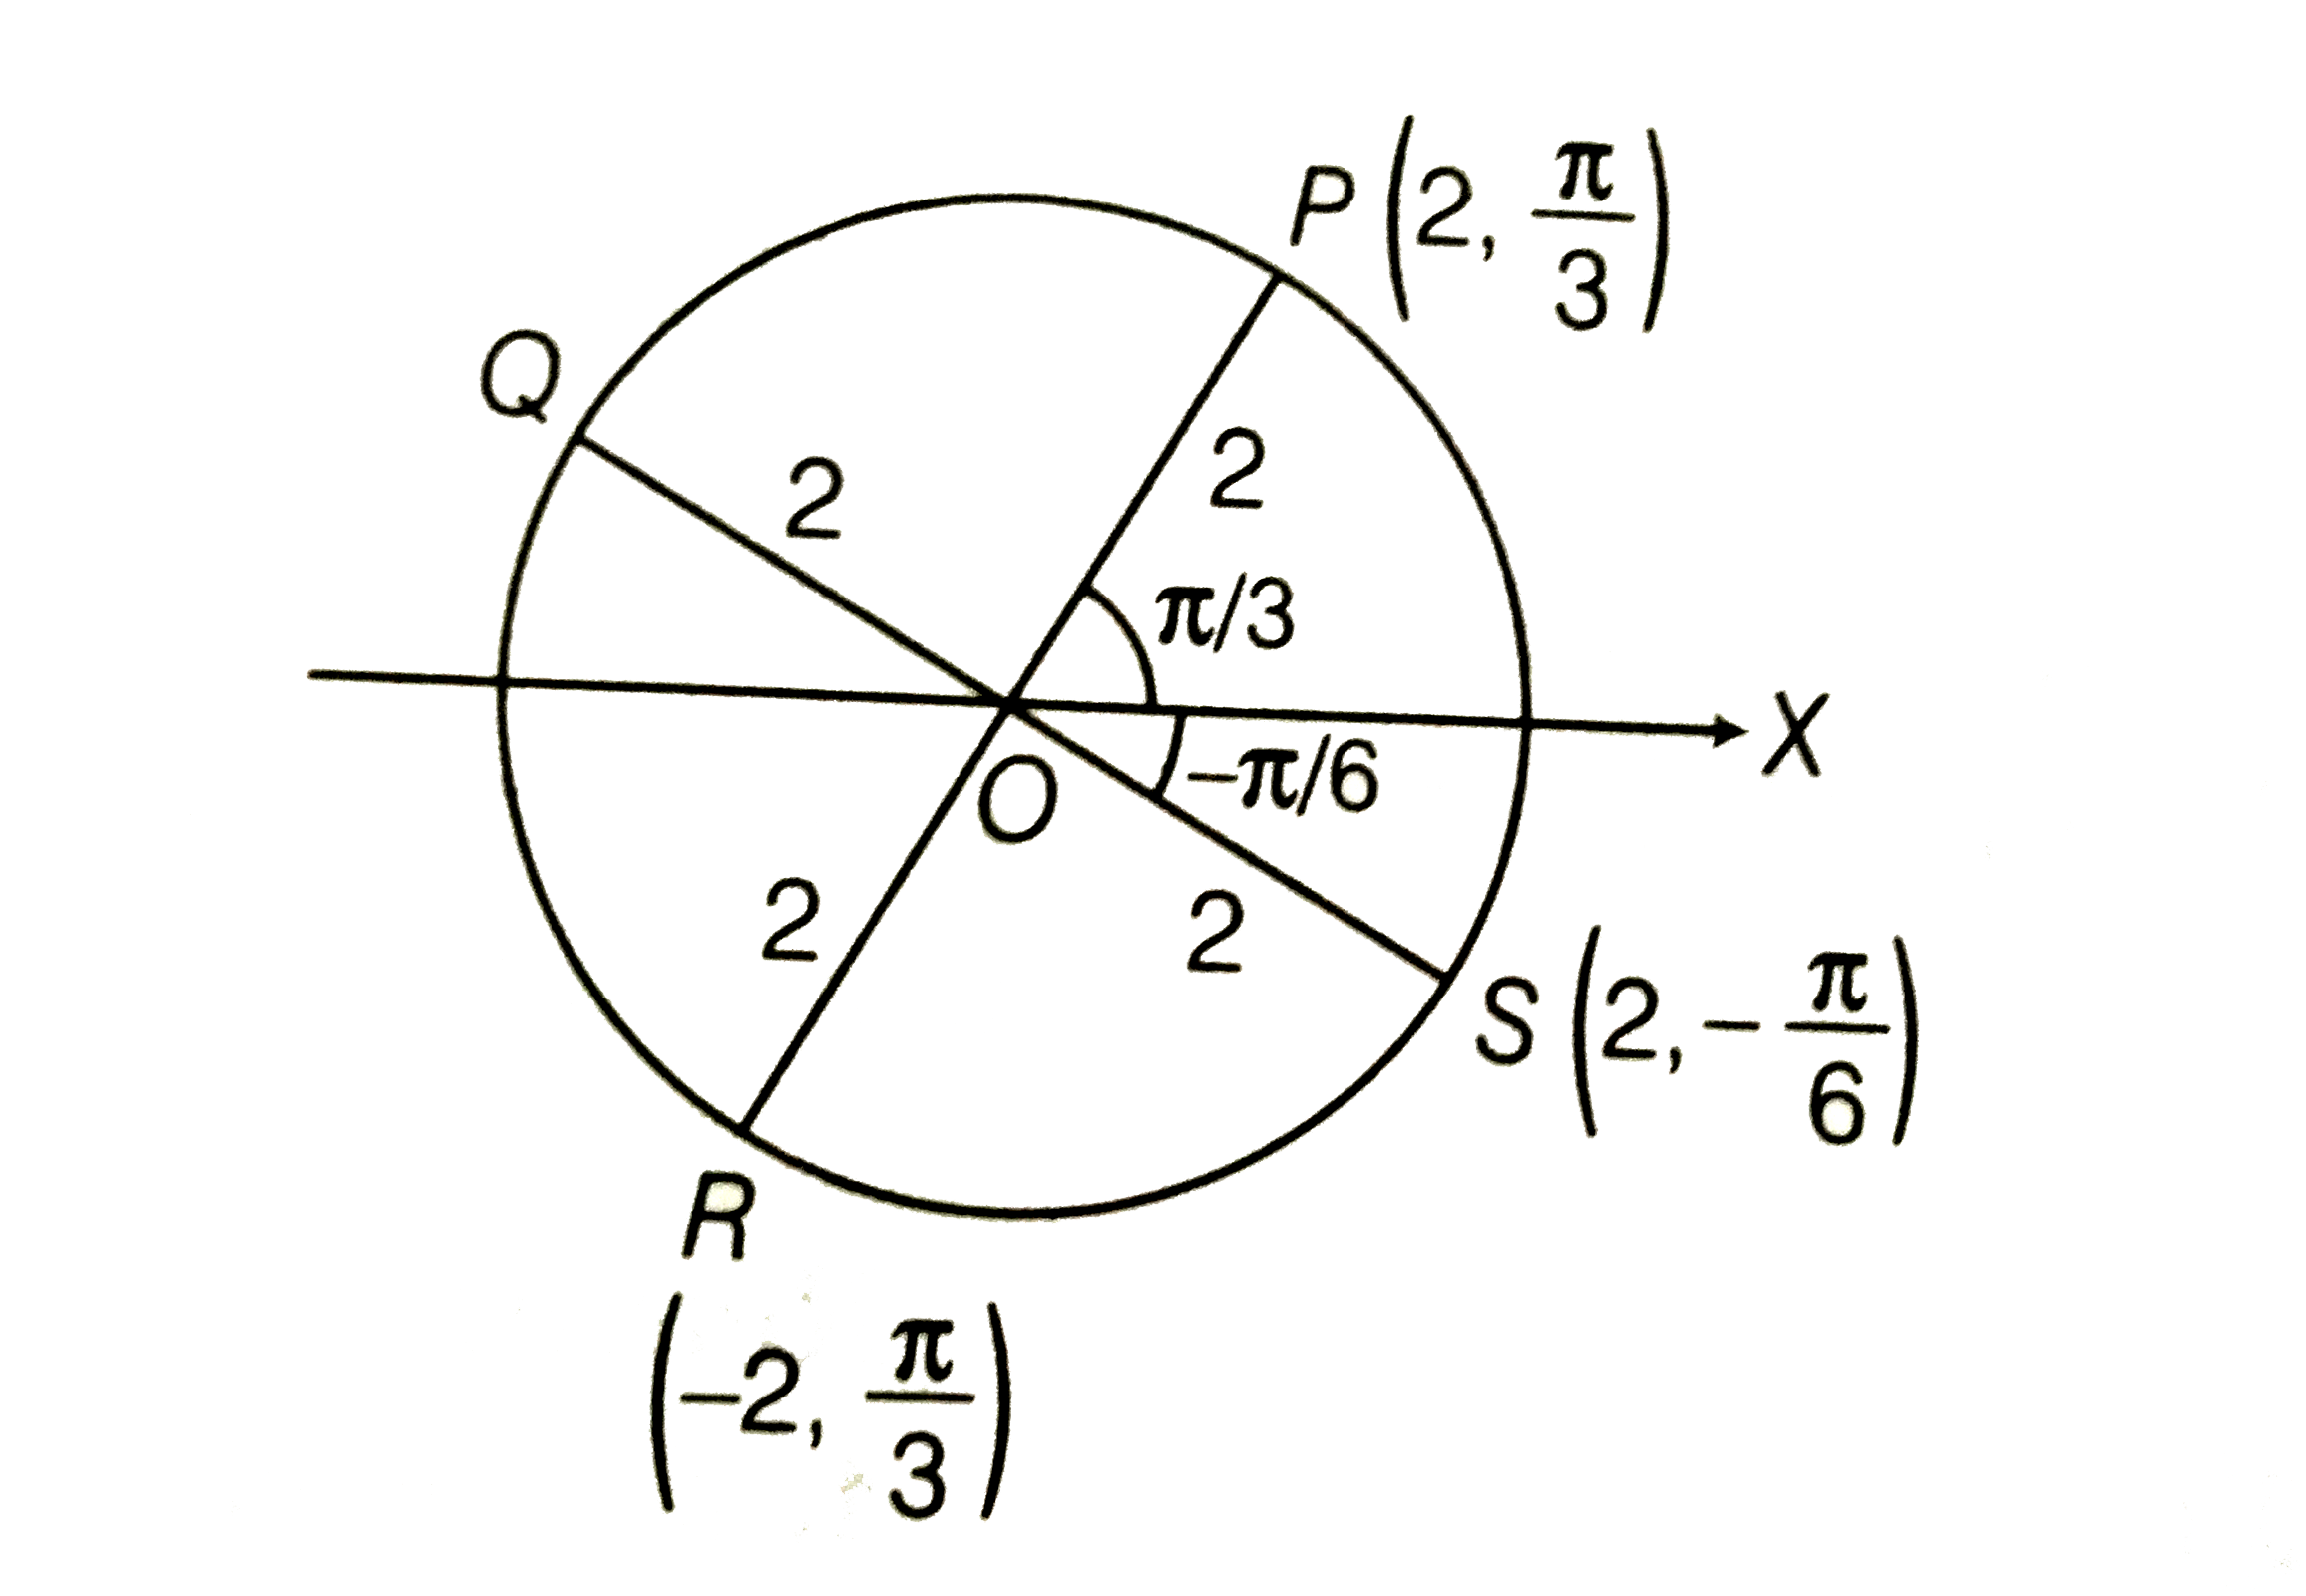
The cartesian coordinates of the point Q in the figure is
 Solution in Punjabi
(√3,1)
(−√3,1)
(−√3,−1)
(√3,−1)
The correct Answer is:B
Step by step video & image solution for The cartesian coordinates of the point Q in the figure is by Maths experts to help you in doubts & scoring excellent marks in Class 12 exams.
Updated on:21/07/2023Topper's Solved these Questions
- COORDINATE SYSTEM AND COORDINATES BOOK - ARIHANT MATHSCHAPTER - COORDINATE SYSTEM AND COORDINATES EXERCISE - Exercise For Session 2
19 Videos
- COORDINATE SYSTEM AND COORDINATES BOOK - ARIHANT MATHSCHAPTER - COORDINATE SYSTEM AND COORDINATES EXERCISE - Exercise For Session 3
19 Videos
- COORDINATE SYSTEM AND COORDINATES BOOK - ARIHANT MATHSCHAPTER - COORDINATE SYSTEM AND COORDINATES EXERCISE - SINGLE OPTION CORRECT TYPE QUESTIONS
1 Videos
- CONTINUITY AND DIFFERENTIABILITYBOOK - ARIHANT MATHSCHAPTER - CONTINUITY AND DIFFERENTIABILITYEXERCISE - Exercise (Questions Asked In Previous 13 Years Exam)
20 Videos
- DEFINITE INTEGRALBOOK - ARIHANT MATHSCHAPTER - DEFINITE INTEGRALEXERCISE - Exercise (Questions Asked In Previous 13 Years Exam)
37 Videos
Similar Questions
If the distance between the points (a, 2) and (3, 4) be 8, then a equals to
View SolutionThe coordinates of the middle points of the sides of a triangle are (4, 2), (3, 3) and (2, 2), then coordinates of centroid are
View SolutionDifferentiate cotx with respect to x.
View SolutionFor every pair of continuous function f,g:[0,1]→R such that max {f(x):x∈[0,1]}=max{g(x):x∈[0,1]}. The correct statement(s) is (are)
View SolutionThe total number of distinct x ∈ R for which
∣∣ ∣ ∣∣xx21+x32x4x21+8x33x9x21+27x3∣∣ ∣ ∣∣=10 is
View SolutionHow many lines of symmetry does the above figure have ?
View SolutionDetermine the point of symmetry of a regular hexagon.
View SolutionDtermine the images of the following figure about the given line :
View SolutionMatch the following Column A to Column B

View SolutionMatch the following Column A to Column B

View SolutionMatch the following Column A to Column B

View SolutionFind the area of the figure given below.

View SolutionThe area of the shaded part in the figure given below is ______.

View SolutionThe inequation represented by the graph given below is :
View SolutionThe inequation that best describes the graph given below is _________
View SolutionThe inequation that best describes the following graph is _________
View Solution
